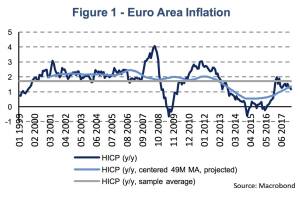
Decomposing subdued inflation in the Euro Area (Martin Ertl)
05 Mar

Euro Area inflation has remained broadly unchanged in February with core inflation at 1 %. The historical average of core inflation is 1.4 % (1999-) and 1.6 % during the pre-crisis period. Lower than average inflation in services is the underlying factor of subdued inflation post 2017. Additional support from non-core components is needed for the ECB to fulfil its inflation target. Last week Eurostat has released its flash estimate for Euro Area inflation for February 2018. Euro Area inflation was reported at 1.2 % (y y) compared to 1.3 % in January. The flash estimate attributes the decline in inflation to slower price growth within the category food, alcohol & tobacco (1.1 %, y y). Energy prices increased by 2.1 % (y y) and core inflation, which excludes the categories energy and food... » Weiterlesen
Some thoughts on US long-term yields: Expectations and expectation uncertainty (Ma...
26 Feb

Expectations and Expectation Uncertainty: some thoughts on US long-term yields Market expectations of increased monetary policy tightening by the Fed have built up continuously. Inflation expectations have increased lately but remain anchored at the Federal Reserve’s inflation target of 2 %. The term premium’s U-turn is associated with a rather sudden acceleration of 10Y US Treasuries. The inflation risk premium sets sail to reach positive territory. During the first eight weeks of 2018, we have seen marked increases in government bond yields. US Treasuries at maturities of 10 years have gained almost 50 basis points (bp) trading close to 2.9 %. Comparable German Bunds have increased by around 30 bp reaching 0.7 %. The pick-up in yields has received widespread public attentio... » Weiterlesen
Last pieces of GDP-evidence confirm a favorable year 2017 (Martin Ertl)
19 Feb

Euro Area sustains the pace of its economic expansion: 0.6 % (q q) GDP growth in Q4 2017. In 2017 the Austrian economy expanded by 3.1 % (y y) surpassing Euro Area economic growth by 0.6 %-points. The Euro Area’s economic expansion continues to follow a supportive trend. Last week’s Eurostat flash estimate of Gross Domestic Product (GDP) for Q4 2017 has confirmed the preliminary estimate of 0.6 % seasonally adjusted quarter-on-quarter (swda, q q) growth. Compared to the fourth quarter of 2016, the Euro Area’s economy expanded by 2.7 % (swda, y y) which translates into an annual growth rate of 2.5 % (swda, y y) for the whole year of 2017. Among the bigger Euro Area economies, the growth momentum during the fourth quarter of 2017 was broadly in line with the Euro Area average. The... » Weiterlesen
USA: The impatience of stock markets (Martin Ertl)
12 Feb

We examine the link between wage growth and inflation. Prices are rigid and adjust slowly. A one %-age point rise in wages leads to 0.6 %-age points increase in prices of goods and services. It takes around one year for prices to fully adjust. Stock and bond markets plummeted following the release of the January US employment report on Friday 2 nd February. Some commentators argued that this is not pure coincidence but investors’ fear of higher wages, higher inflation and higher treasury bond yields. The most important figures of the monthly report from the Bureau of Labor Statistics (BLS) are the non-farm payrolls job growth (NFP), the unemployment rate (UR) and the average hourly earnings (AHE). The prints in NFP (200.000 new jobs), the unemployment rate (4.1 %) were unexciting, while th... » Weiterlesen
Business cycles in the US, Euro Area and Austria (Martin Ertl)
05 Feb

USA: Solid domestic demand by year-end No changes at Chair Yellen’s last FOMC In the final quarter of 2017, the US real GDP rose by 2.6 % (q q, annualized rate) after 3.2 % in Q3 (Figure 1), according to the first release of the Bureau of Economic Analysis (BEA). While the headline GDP remained below expectations (Bloomberg consensus estimate: 3.0 %, Atlanta Fed GDPNow: 3.4 %, NY Fed GDP nowcast: 3.9 %), the details revealed a solid state of the domestic US economy. Personal consumption expenditure and fixed investments increased by 3.8 % and 7.9 %. The investments breakdown shows that investment in equipment and structures rose by 11.4 % and 1.4 % and residential investment increased by 11.6 % drawing a positive picture of the cyclical components of GDP. On the other side, firms had t... » Weiterlesen
 31.07.24
global market. 7 Monate 2024 sind vorbei und die Wiener Börse hat in diesen sieben Monaten mehr Handelsvolumina verbuchen können als in den ersten 7 Monaten 2023, der Zuwachs ist im einstelligen Prozentbereich, aber immerhin. Auch im früher stark promoteten global market ist es erstmals seit Jahren wieder etwas nach oben gegangen, im Gesamtjahr 2021 lag dort das Jahresvolumen noch bei 5,5 Mrd. (das ist ca. ein Monatsumsatz im Prime Market), 2022 waren es nur noch 1,3 Mrd.. und 2023 gab es sogar den Fall unter die Mrd. Euro. In den ersten sieben Monaten 2024 ist es wieder leicht nach oben gegangen, ob die Mrd. End of Year wieder erreicht werden kann, ist aber unklar. Es gibt zwar im global market günstige Konditionen, aber die Broker stellen Wien bei den internationalen Aktien nicht so in die Pole Position und die Markttiefe könnte natürlich ebenfalls besser sein. Keine einfache Aufgabe, diese wichtigste Aktienfacette im Vienna MTF, denn es geht immerhin um die wichtigsten Aktien der Welt. Ich bin ja der Meinung, dass das Tagesgeschäft viel mehr promotet gehört, davon würde auch der global market profitieren.
 17.07.24


