Germany’s growth outlook and CEE’s resilience (Martin Ertl)
Germany’s growth outlook
- Economic growth slowed significantly in H2 2018.
- A foregone opportunity: We discuss Germany’s lack of public investment.
Germany’s real gross domestic product (GDP) stagnated during the last quarter of 2018 after it had declined by 0.2 % (q/q) in the previous quarter. In seasonally-adjusted terms, the year-on-year growth rate decreased to 0.6 % (after 1.2 % in Q3 and 2.0 % during H1 2018). Annual GDP growth slowed from 2.5 % in 2017 to 1.5 % last year. In non-seasonally adjusted terms, the annual growth rate of GDP was 1.4 % and, hence, slightly lower than reported in January (1.5 %) by the German statistics office (Destatis [1]).
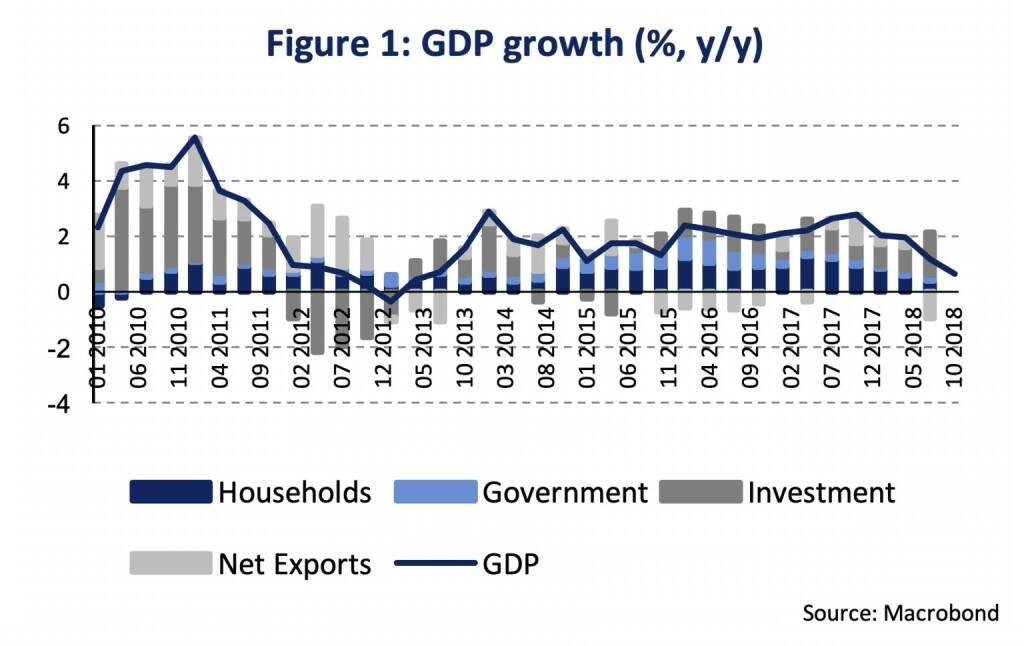
There were no expenditure details yet released by Destatis, however, it was noted in the press release that domestic demand contributed positively to quarter-on-quarter GDP growth and the development of foreign trade subtracted from GDP growth. Household consumption increased slightly and government final consumption expenditure was markedly up by year-end. Gross fixed investment, especially in construction but also in machinery & equipment, increased markedly in Q4 2018, as noted by Destatis. During the last four quarters (Q4 2017-Q3 2018), gross fixed capital formation had massively contributed to GDP growth (0.9 %-age points on average), as can be seen in Figure 1. On the other side, new orders for manufacturing goods, which usually lead investment activity, slid during Q4 and, hence, dampen the investment prospects for the coming months (Figure 2). It has been argued that temporary factors held back growth during the second half of last year (changes in emissions standards in the automobile sector, low river water gauges), but even assuming a growth rebound in Q1, the German economy will hardly grow by more than 1.0 % in 2019.
The outlook for investment and economic growth seems to deteriorate. Net trade dampens GDP growth. The expectations for foreign trade to maintain Germany’s business cycle are worsening due to slowing foreign demand. Yet, recent wage gains – growth in labor compensation picked up in 2018 (+2.9 % y/y in Q1-Q3) – support households’ consumption expenditure. Total investment fosters GDP growth (Figure 1), though prospects are uncertain. Eventually, low external demand will slow down private investment.
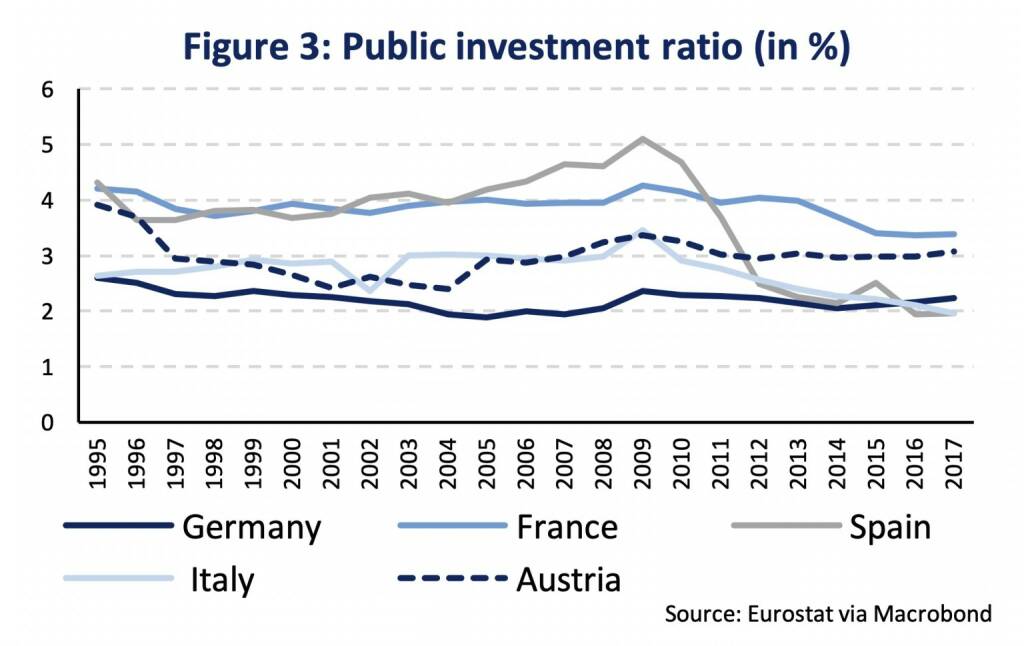
Can public investment compensate for a likely slowdown in private investment expenditure? Figure 3 compares the investment ratio of the Germany’s public sector with other Euro Area countries. The investment ratio is defined as gross fixed capital formation to nominal GDP. Gross fixed capital formation is investment net of inventories (“fixed”) and – compared to net fixed capital formation – it does not account for depreciation in the capital stock.
It can be seen that the investment ratio of the public sector in Germany has been low since 1995 (2.2 % on average) compared to France, Spain, Italy and Austria. Since the global financial crisis (GFC), public investment to GDP decreased in Spain and Italy and dropped below Germany’s investment ratio. In 2017, the investment ratio was 3.4 % in France, 3.1 % in Austria, 2.2 % in Germany and 2.0 % in Spain and Italy.
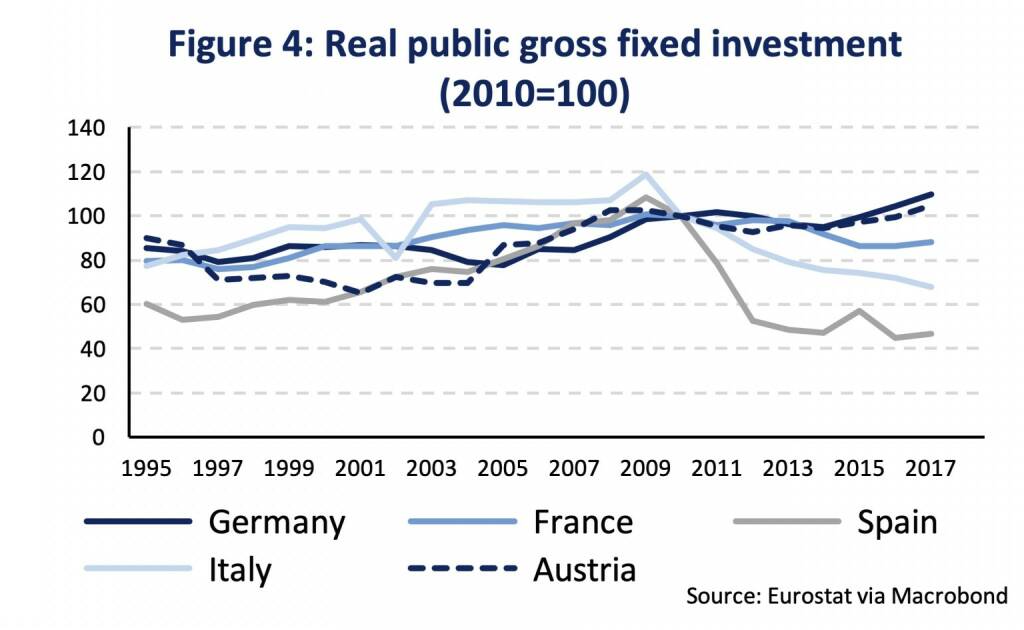
Another perspective is given by looking at the development of real public gross fixed capital formation, i. e. by adjusting for price changes. We construct these time series by normalizing public gross fixed capital formation to the year 2010 and adjusting by the price deflators for total gross fixed capital formation (Figure 4).
German real public gross fixed investment decreased after 2011 and rose again in 2015 and 2017. In 2017, the annual real investment was roughly 10 % higher than in 2010. Austria a saw rise of around 40 % of public gross fixed investment between 2001-2009. After lower real public investment following the GFC it was around 5 % higher in 2017 compared to 2010. France’s real public investment did not share the recent upward in Germany and Austria and was around 12 % lower in 2017 than in 2010. Also note the significant fall of public investment in Spain and Italy since the GFC.
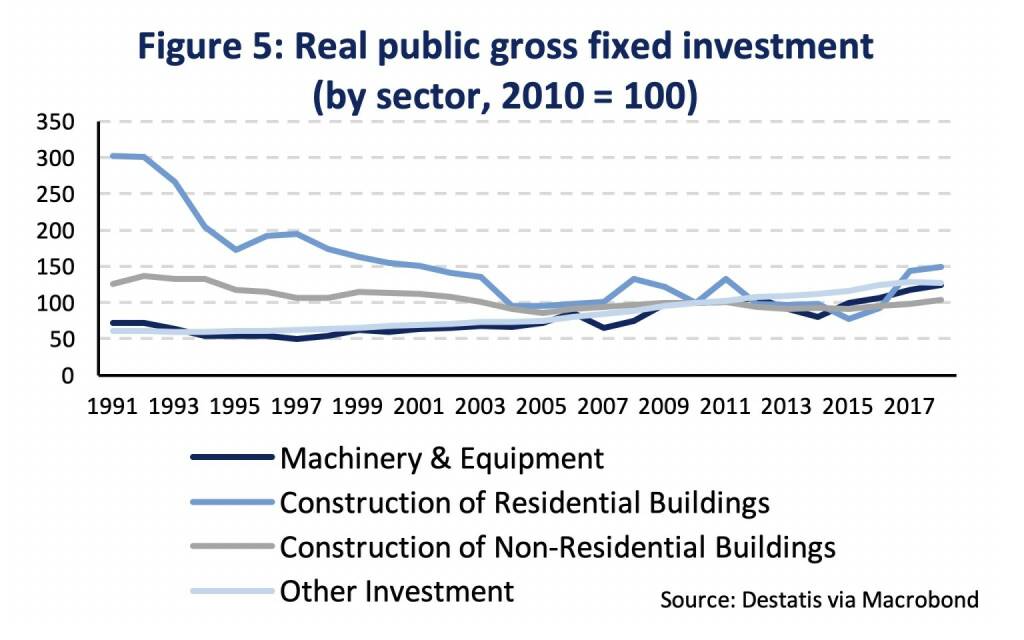
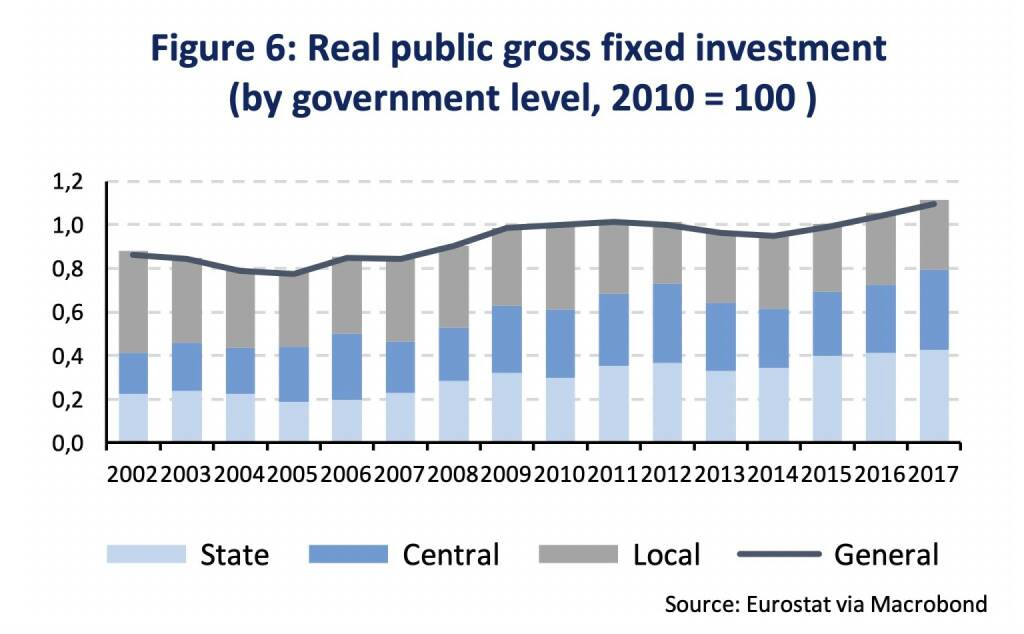
Next, it might be interesting to see how public investment evolved in different sectors (machinery & equipment, construction in residential and non-residential buildings, other sectors) and at different levels of government (central, state and local) in Germany (Figure 5 and 6).
Which trends are notable? In Germany, investment in construction of residential buildings decreased significantly since the 1990s. In the early 1990s real public investment in residential construction was three times higher than in 2010. It picked up in 2017 and 2018 but is still around half the level of the 1990s. Investment in non-residential buildings decreased also since the 1990s and early 2000s but remained roughly constant afterwards. Only in 2018, public investment in non-residential buildings outnumbered the level in 2010. Investment in machinery and equipment had a steady upward trend over time. From a government level perspective, it is notable that the contribution from the local government to total public investment decreased steadily since 2002, while the contributions from the central and state government both roughly doubled over time. Hence, trends of investment in sectors and government levels suggest a lack of residential investment which might be linked to lower investment at the local (municipality) level.
In Germany, economic growth slowed markedly during H2 2018. Quarterly GDP stagnated by year-end. External demand likely ceases as a growth driver with knock-on effects on domestic business investment. Germany’s public investment ratio is low compared to other Euro Area countries. A rise in real public investment has not induced a catch-up in the investment rate to the levels in France or Austria. On the other side, we also document the fall in public investment that occurred in Italy and Spain since the GCF. From a sectoral view, public investment in construction – both residential and non-residential – declined significantly since the 1990s. We also show the declining share of local investment in overall public investment. Roth and Wolf (2018) argue that public spending decreased in crucial sectors such as education (for example, school buildings at local government level), housing and defense [2]. The maintenance of the quality of the transport infrastructure has been part of an ongoing debate. A government programme aims to repair down-and-out bridges for expenditure of 9.3 billion EUR (0.3 % of GDP) until 2030. From a cyclical view, public investment is a foregone opportunity. Usually, public construction investment takes long lags to being build and fully unfold its positive effects on the economy. In the short term, it likely could not counter the cooling which is already underway but stabilize a deeper slowdown in the years ahead.
***
CEE’s resilience to Euro Area’s growth slowdown
- Preliminary estimates of GDP growth in Central Eastern Europe show continued strong growth momentum in the region during Q4 2018.
- As growth is mainly based on domestic demand, the impact of lower growth in the Euro Area, and Germany in particular, has been subdued so far.
The Central Eastern European (CEE) region continues to show solid growth momentum. Last week’s releases of preliminary estimates for GDP growth in Q4 2018 was again broadly positive, succeeding a strong third quarter. So far, the region shows surprising resilience to the growth slow-down in the Euro Area. Balanced growth with domestic demand as the main driver makes growth rather resilient.
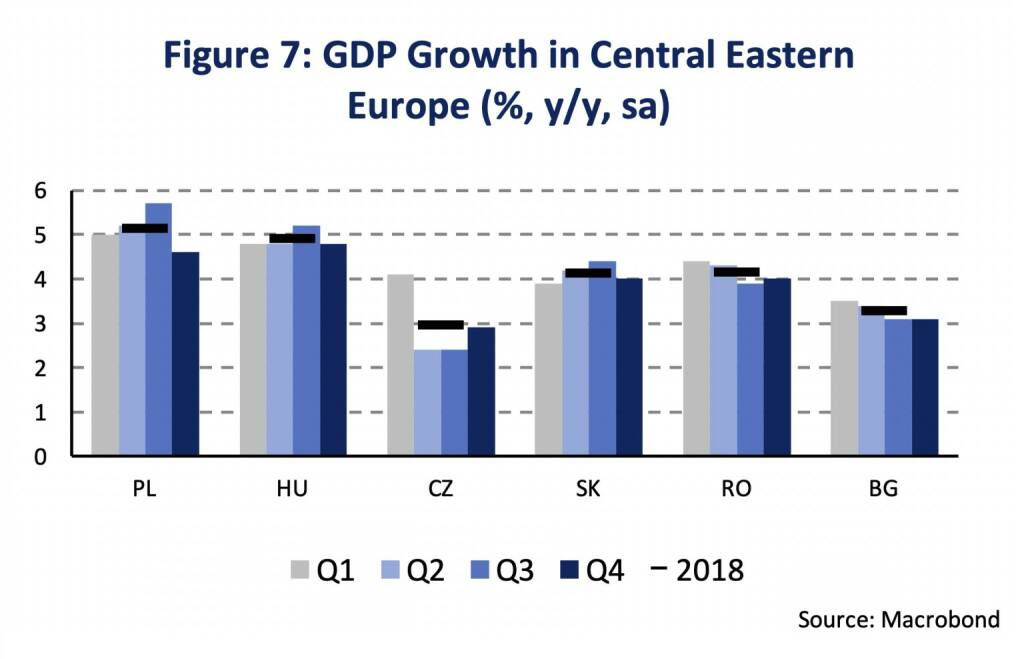
In Poland the economy expanded by 4.6 % during Q4 2018, compared to Q4 2017 (y/y) and being seasonally adjusted (sa). This is somewhat lower than the average of the first three quarters (5.3 %), though, still among the highest growth rates in Europe. In Q4 only Hungary reported GDP figures exceeding the growth rate seen in Poland. The Hungarian economy expanded by 4.8 % (y/y, sa) in Q4 2018, which is broadly in line with the growth rate for the whole year of 2018 at 4.9 % (Figure 7). In the Czech Republic, where GDP growth has already slowed down towards more sustainable levels in Q2 and Q3 2018, the fourth quarter pushed GDP growth to 3.0 % in 2018. Looking at quarter-on-quarter growth, better capturing the underlying growth momentum, the Czech Republic expanded by 1.0 %, compared to 1.1 % in Hungary and 0.5 % in Poland. In Slovakia, growth momentum has slowed down somewhat compared to the first three quarters of the year, though, remains elevated (0.8 %, q/q, Q4 2018). The Slovak economy expanded by 4.1 % in 2018 and 4.0 % in Q4. Another CEE economy which managed to achieve GDP growth above 4 % in 2018 is Romania. GDP growth was 4.0 % in the final quarter of the year, after 4.4 % in Q1, 4.3 % in Q2 and 3.9 % in Q3. In Bulgaria GDP growth is somewhat lower. For the whole year of 2018, the economy reports a growth rate at 3.3 %, with 3.1 % GDP growth during the final quarter.
Even if the expenditure structure of GDP growth during the final quarter of the year has not yet been released, the trend of the first three quarters shows quite clearly that GDP growth in the region has predominantly been driven by domestic demand. Slovakia is the only country, where export growth (4.8 %, y/y) exceeded import growth (4.4 %). In Poland (5.7 % vs. 7.0 %), Hungary (5.3 % vs. 6.8 %), the Czech Republic (4.5 % vs. 5.8 %), Romania (6.1 % vs. 9.3 %) and Bulgaria (-1.5 % vs. 4.5 %) exports of goods and services expanded less rapidly than imports of goods and services. Net exports, thus, subtracted from GDP growth in all economies except for Slovakia. Strong growth in household consumption coupled with accelerated investment activity has fueled growth in the CEE region in 2018.
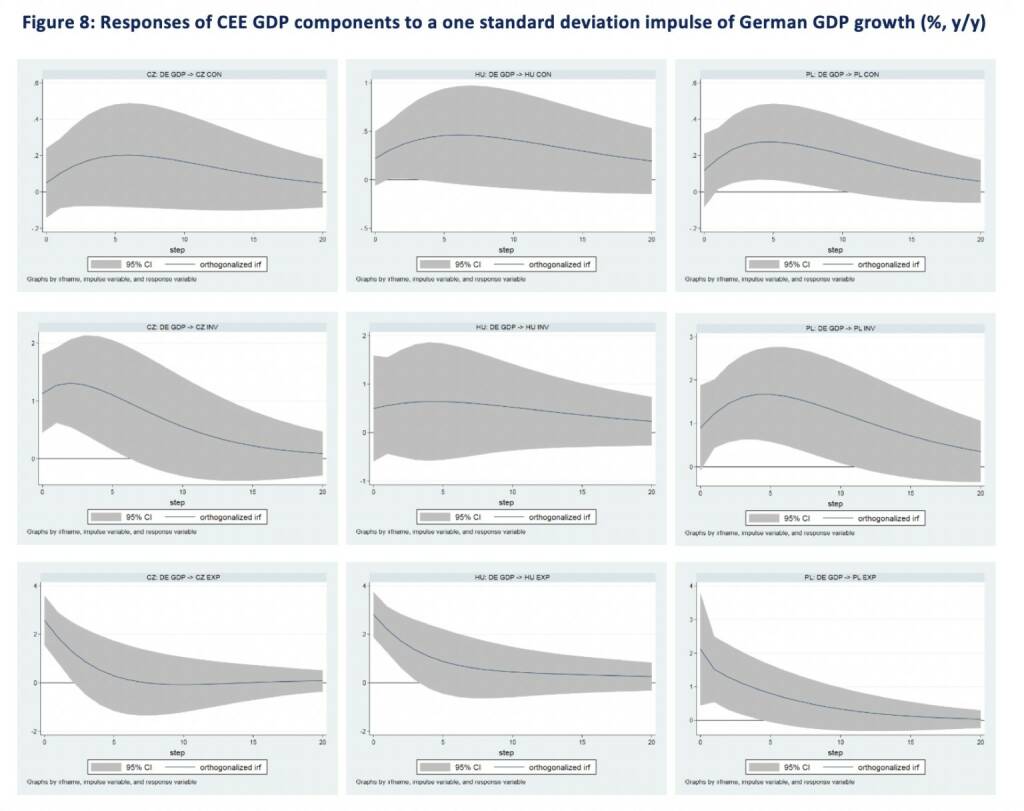
Strong domestic demand can further be linked to the resilience of the CEE region towards slower growth momentum in the Euro Area. The economies of the region are small and open and are, thus, exposed to their trading partner’s business cycles. Yet, economic spillovers are most substantially transmitted through exports and, though to a lesser extent, investment. The effect on consumption, which is currently the key growth drivers in CEE, is much weaker and less easily identified empirically. Based on a vector-autoregressive framework we empirically evaluate the response of CEE (CZ, HU, PL) GDP components to a shock in German GDP growth (Figure 8). The graphs display the response by consumption (CON, first row), investment (INV, second row) and exports (EXP, third row) to a one standard-deviation shock to German year-on-year GDP growth over the course of 20 quarters (horizontal axis). As one would expect, the most immediate response is identified for exports of goods and services (third row). The effect is of similar magnitude in all three CEE economies. The effect on investment (second row) is weaker, even not statistically significant in Hungary, and grows in magnitude until the third-to-fourth quarter. The effect on consumption (first row) is much weaker than on exports and investment and tends to be statistically indistinguishable from zero (except for Poland). The impulse-response functions also show that it takes longer until the effect can be seen in the GDP’s consumption component. This analysis suggests that the current structure of GDP growth in the CEE region makes them more resilient to slower growth in Germany. However, it also shows that the effect on investment as well as consumption, even though being smaller, takes up to a year to fully materialize. Hence, the growth of domestic demand in CEE might be dampened by the weakness of the German business cycle throughout the year 2019.
[1]Two weeks ago, we had argued in this publication, that the annual GDP estimate that was released by Destatis appears too high (UNIQA Capital Markets Weekly as of 4th February 2019).http://press-uniqagroup.com/News_Detail.aspx?id=79089&menueid=1686
[2]Roth, A. and G. B. Wolf (2018): Understanding (the lack of) German public investment, Bruegel blog post (19th June 2018), http://bruegel.org/2018/06/understanding-the-lack-of-german-public-investment/
Authors
Martin Ertl Franz Xaver Zobl
Chief Economist Economist
UNIQA Capital Markets GmbH UNIQA Capital Markets GmbH
)
Latest Blogs
» SportWoche Podcast #124: Liam Ferguson, de...
» Österreich-Depots: Ultimo-Bilanz mit Addik...
» Börsegeschichte 30.8.: Warren Buffett (Bör...
» PIR-News: Zahlen von Warimpex, Strabag, Ne...
» Nachlese: Karin Bauer, LLB Aktien Österrei...
» Wiener Börse Party #727: Nächster Rekord-T...
» Börsenradio Live-Blick 30/8: DAX krönt Erh...
» Börse-Inputs auf Spotify zu u.a. ATX TR, L...
» ATX-Trends: Immofinanz, UBM, CA Immo, S Im...
» Börsepeople im Podcast S14/17: Karin Bauer

Weitere Blogs von Martin Ertl
» Stabilization at a moderate pace (Martin E...
Business and sentiment indicators have stabilized at low levels, a turning point has not yet b...
» USA: The ‘Mid-cycle’ adjustment in key int...
US: The ‘Mid-cycle’ interest rate adjustment is done. The Fed concludes its adj...
» Quarterly Macroeconomic Outlook: Lower gro...
Global economic prospects further weakened as trade disputes remain unsolved. Deceleration has...
» Macroeconomic effects of unconventional mo...
New monetary stimulus package lowers the deposit facility rate to -0.5 % and restarts QE at a ...
» New ECB QE and its effects on interest rat...
The ECB is expected to introduce new unconventional monetary policy measures. First, we cal...