Economic Convergence in Central and Eastern Europe revisited (Martin Ertl)
- CEE economies are closing the income gap to Western Europe.
- Convergence was strongest in the immediate pre-crisis period and has diminished since then, though, remains active at least within the EU.
- Convergence has been faster within the EU than in non-EU countries and particularly rapid in EU member states of the CEE region.
- Education and FDI are positively associated with GDP per capita growth, as is institutional quality within the EU.
Central and Eastern Europe (CEE) is among the fastest growing world regions. In 2017, gross domestic product (GDP) in CEE, excluding Russia, expanded by 4.4 %[1]. Only Emerging Asia was growing more rapidly (6.1 %) while Developed Economies (2.4 %) and Latin America (1.1 %) experienced slower growth, as did the global economy (3.7 %). Moreover, strong growth momentum has been prolonged into 2018 and we expect the CEE region to continue outperforming developed economies also for the years to come (Figure 1).
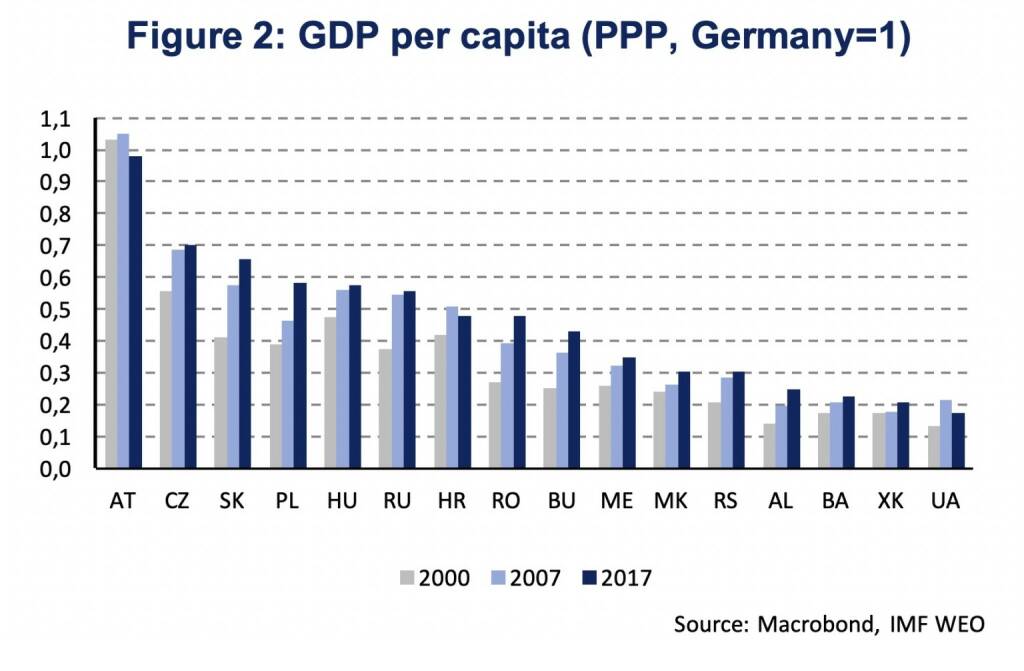
With respect to the level of GDP per capita, CEE has made substantial progress in closing the gap to more advanced economies, like Germany. Figure 2 shows the relative level of GDP per capita in purchasing power parity (PPP) for the benchmark years 2000, 2007 and 2017. In Poland, for instance, GDP per capita was only 39 % of the German level in 2000, increasing to 46 % by 2007 and 58 % in 2017. This implies that between 2000 and 2017 the average growth rate of GDP per capita was faster in Poland than in Germany, a phenomenon which economists call catch-up growth. Among the fastest growing economies between 2000 and 2017 were Albania, Bulgaria and Romania, where GDP per capita relative to Germany increased by more than 70 %.
Standard economic growth theory postulates that countries at lower levels of GDP per capita grow at faster rates and catch-up to more advanced economies [2]. This theoretical concept is known as beta convergence, describing a negative relationship between the level and the growth rate of income per capita due to a higher marginal productivity of capital. Empirically this relationship is not always easy to identify, particularly when ignoring factors shaping an economy’s long-term equilibrium, its steady-state [3]. Economists, therefore, distinguish between conditional and unconditional convergence. Conditional convergence argues that catch-up growth does not occur in isolation but depends, or put differently is conditional, on factors like policies, institutions or other country-specific circumstances. In this analysis we shed some light on catch-up growth and convergence in Europe with a particular focus on the CEE region since the mid-1990s.
Unconditional Convergence
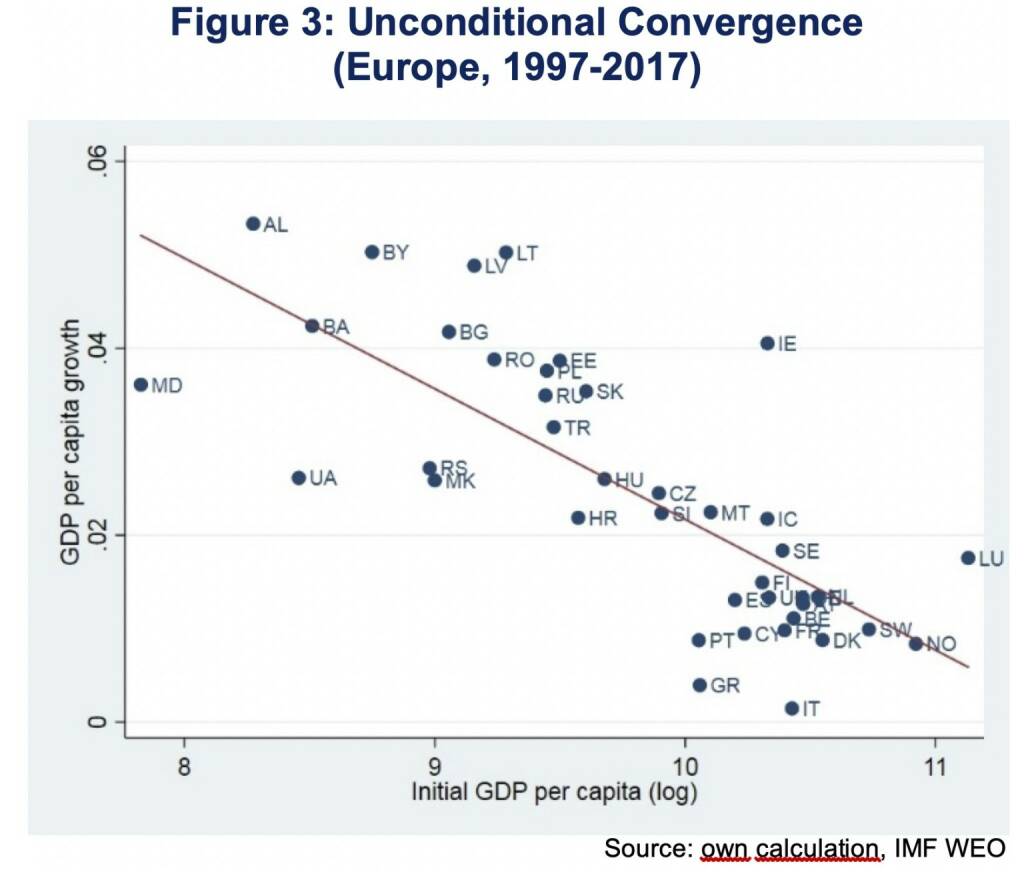
In Europe unconditional convergence can, indeed, be observed for the post 1997 period. Figure 3 shows the proposed negative relationship between the level of GDP per capita, expressed in logarithmic terms at the horizontal axis, and the average annual growth rate of GDP per capita, at the vertical axis, during the period 1997 and 2017. It is worth noting that the sample is not restricted to European Union member states but includes all of Europe, including Turkey and Russia, covering 42 economies [4]. The graph should be read as follows. A country positioned above/below the red line indicates that the annual average growth rate between 1997 and 2017 was higher/lower than its initial level of GDP per capita would have suggested. It can be seen that so-called New Member States (NMS) of the European Union, like the Baltic countries but also Bulgaria and Romania, tend to outperform while Southern European countries are located below the red line of predicted vales.
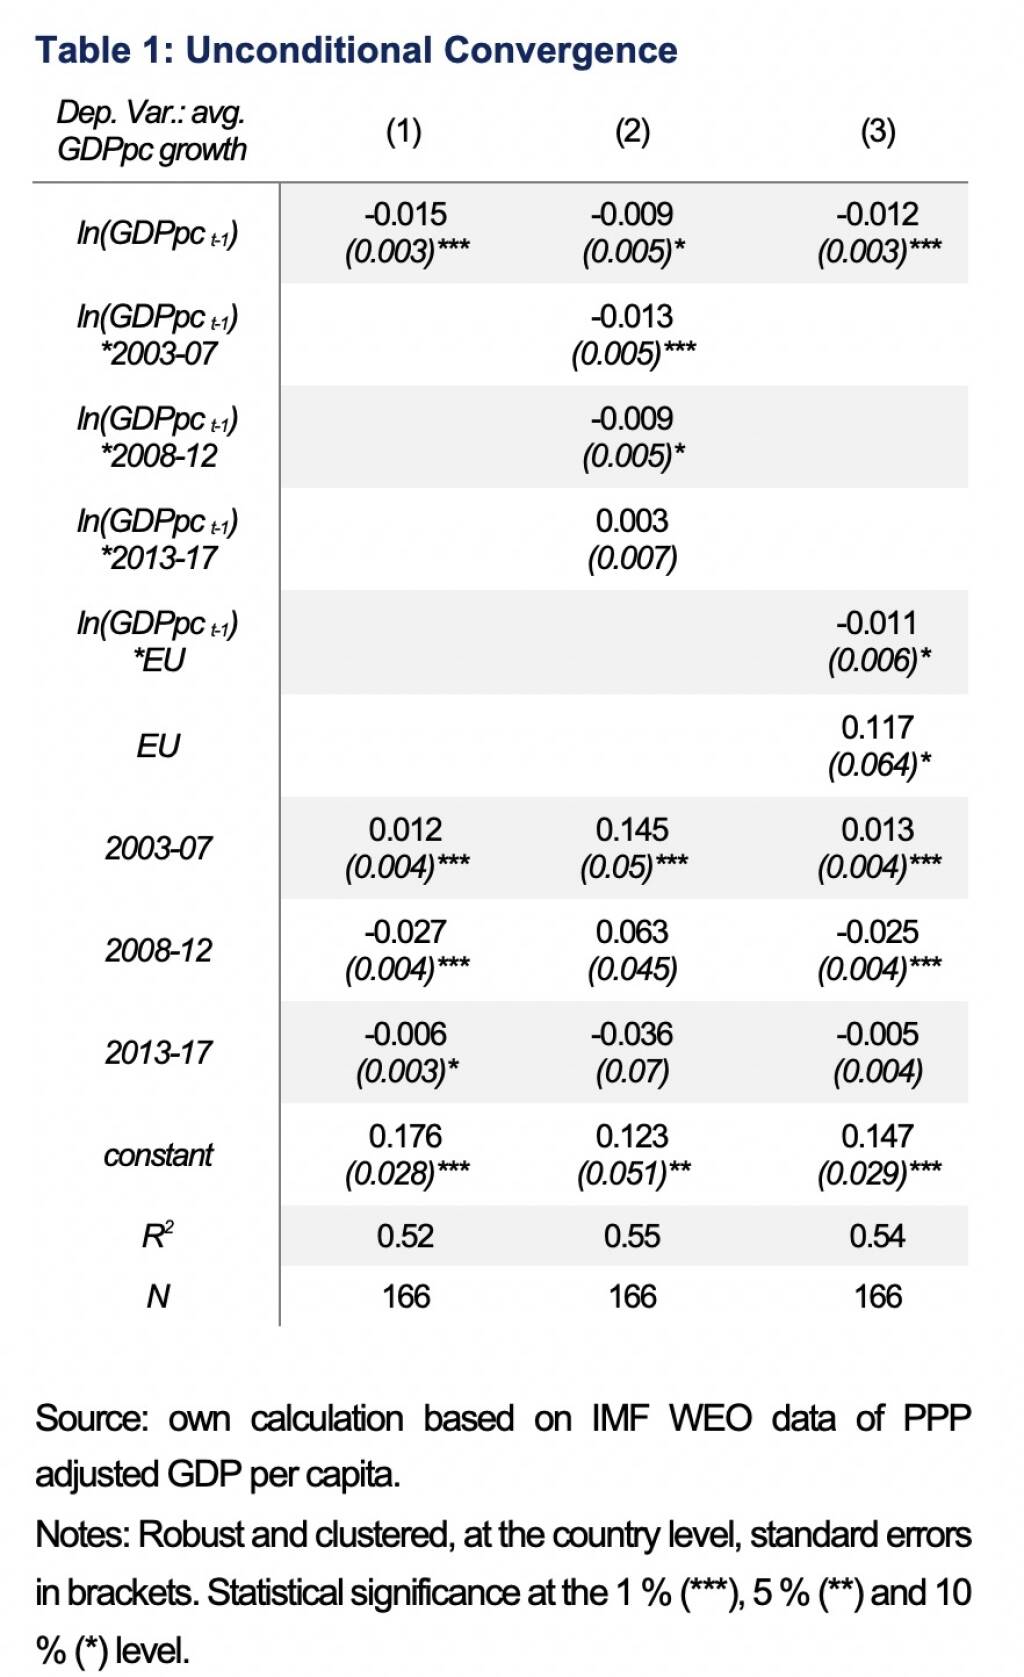
Although figure 3 gives a meaningful first indication, averages over a 20-year long period might not accurately reflect the dynamics of relative growth performance. This can be overcome by applying a panel regression framework covering 42 countries and four periods, each of which span five years starting in 1997 and ending in 2017. The results confirm the suggestive evidence of unconditional convergence from figure 3. The coefficient from specification 1 in table 1 shows that a 1 % lower level of GDP per capita is associated with a 0.015 %-age points higher average annual growth rate, or put differently, that the gaps in levels of real per capita GDP are eliminated by 1.5 % a year. The magnitude of the convergence coefficient is broadly consistent with the iron law of convergence of 2 % per year [5].
Notes: Robust and clustered, at the country level, standard errors in brackets. Statistical significance at the 1 % (***), 5 % (**) and 10 % (*) level.
That convergence has, indeed, differed between the 5-year periods, is shown in specification 2 of table 1. Convergence was strongest at 2.2 % in the immediate pre-crisis period between 2003 and 2007 [6]. However, also during the period covering the Great Recession convergence was only marginally weaker at 1.8 %. The speed of convergence has diminished in the post 2013 period, however, is still existent at a rate similar to the 1998-2002 period.
Unconditional convergence was particularly strong within the member states of the European Union (EU) and roughly twice as fast than for non-EU member states. Specification 3 of table 1 estimates convergence coefficients for both groups, showing a convergence coefficient of 1.2 % for non-EU countries and 2.3 % for EU member states. Using triple interaction terms between periods, the initial level of GDP and EU membership (not shown here) reveals that the period 2003 to 2007 was crucial to explain differences in convergence rates [7].
Conditional Convergence
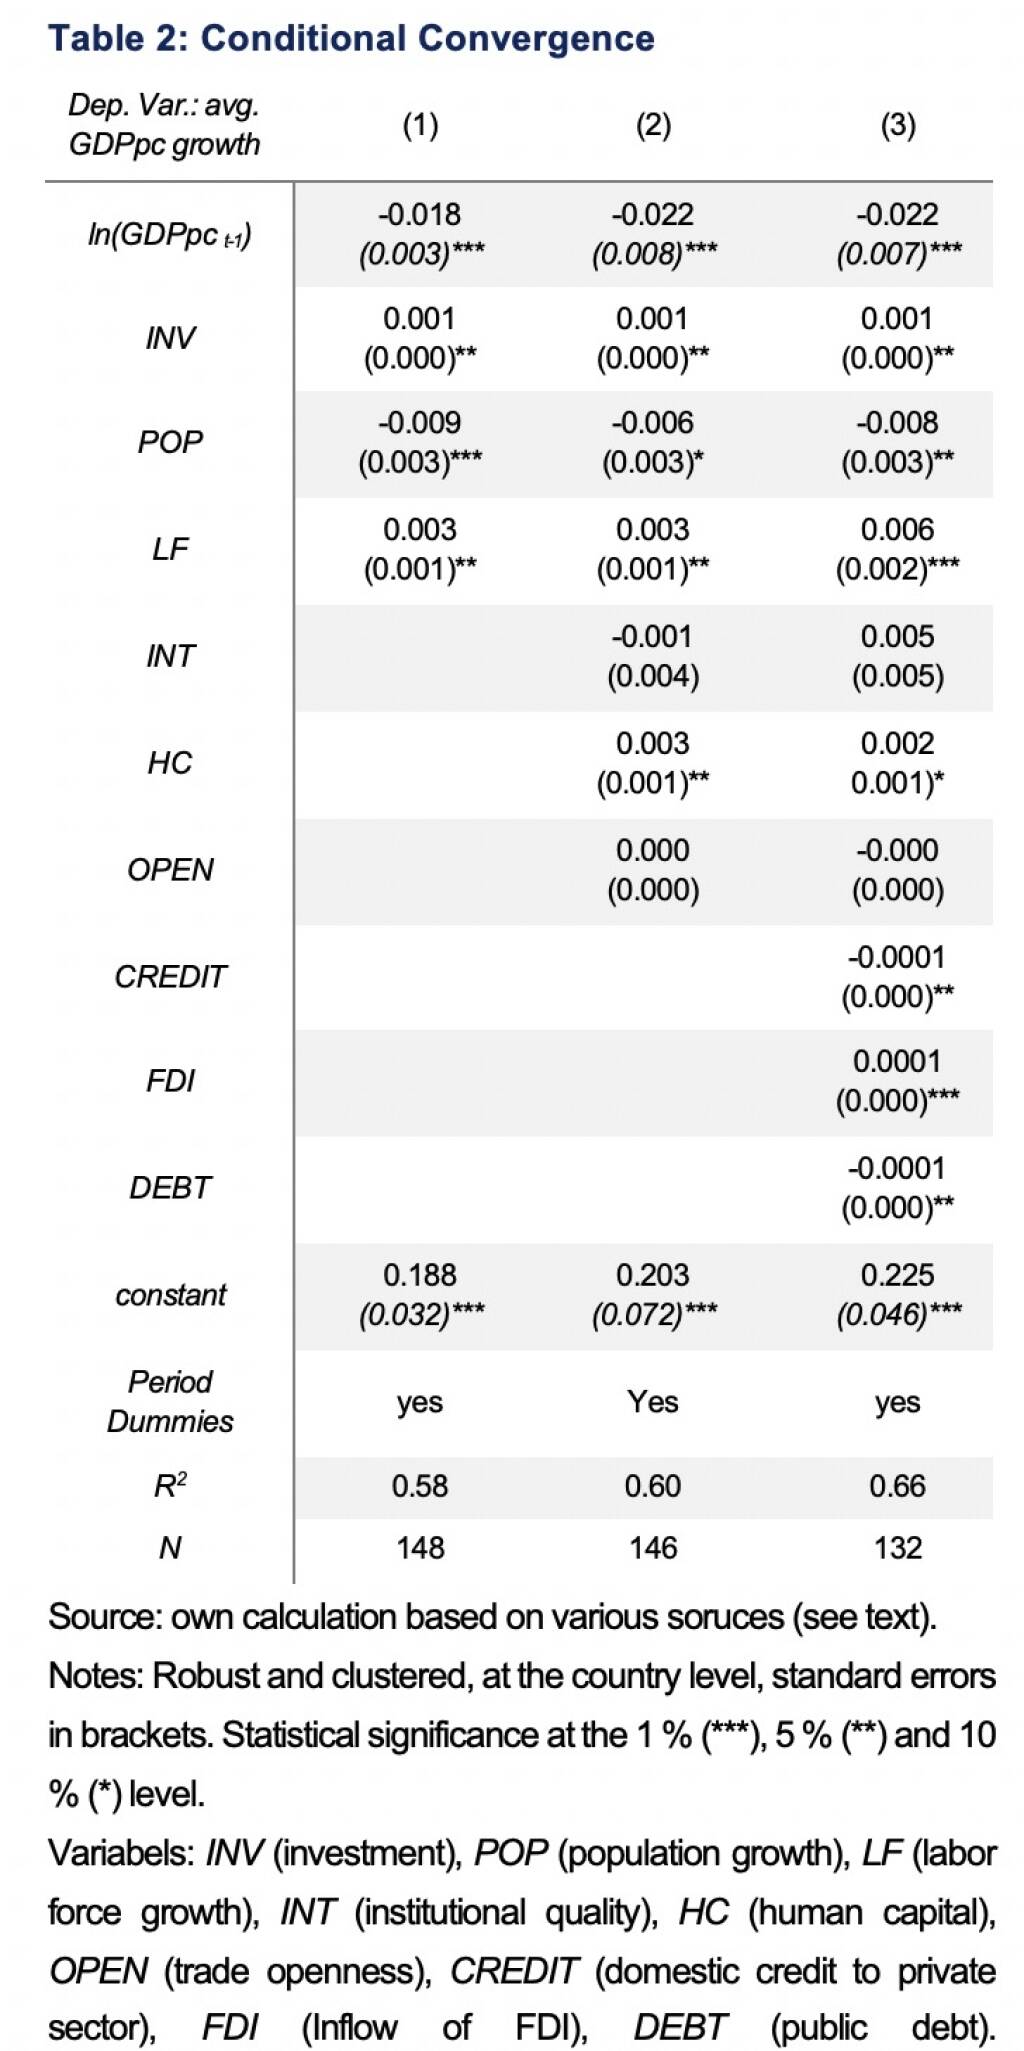
As outlined above, economists distinguish between unconditional and conditional convergence. Structural differences can cause countries to converge to different medium-term equilibria. In analyzing convergence, these structural differences, therefore, need to be considered carefully. Firstly, we consider differences in investment rates, the growth of labor supply and population growth [8]. As a standard growth model would suggest, higher investment and more rapid growth of the labor force are positively associated with GDP per capita growth while population growth shows a negative correlation, see specification 1 of table 2. Adding these control variables has a slight positive effect on the convergence coefficient, increasing to 1.8 %.
Notes: Robust and clustered, at the country level, standard errors in brackets. Statistical significance at the 1 % (***), 5 % (**) and 10 % (*) level.
Variabels: INV (investment), POP (population growth), LF (labor force growth), INT (institutional quality), HC (human capital), OPEN (trade openness), CREDIT (domestic credit to private sector), FDI (Inflow of FDI), DEBT (public debt).
Adding differences in institutional quality (INT), human capital (HC) and trade openness, specification 2, shows a strengthening of the convergence coefficient. Moreover, a well-educated labor force is found to be positively associated with higher GDP per capita growth, irrespectively of the income level. The degree of trade openness cannot be identified as a key driver, even though, there is a tendency for smaller countries to benefit from trade openness. The measure of institutional quality is not found to be positively associated with higher growth for the whole sample of Europe.
These results also hold when adding financial market and public-sector debt, specification 3. High public debt ratios (DEBT) are associated with lower growth. Surprisingly, also credit to the private sector (CREDIT) is negatively correlated with GDP per capita growth, which might be due to the fact that credit to GDP ratios are higher in more advanced countries as well as Southern European countries [9]. On the other hand, the inflow of foreign direct investment (FDI) is associated with higher growth of GDP per capita. The convergence coefficient remains unchanged at 2.2 % [10].
Allowing convergence coefficients to vary across time periods, only the periods 2003-2007 (3.1 %) and 2008-2012 (1.7 %) show statistically significant evidence of conditional convergence, being particularly pronounced for the period 2003 to 2007. Convergence within the European Union was again stronger than for non-EU countries. Moreover, institutional quality matters for growth within the EU, gaining statistical significance when interacted with an EU dummy, or restricting the sample to EU member states. Looking at CEE-EU member states convergence was particularly rapid (5.4 %). The role of the EU for the CEE region is further highlighted by the fact that the speed of convergence is statistically not distinguishable between the whole CEE region and the rest of Europe.
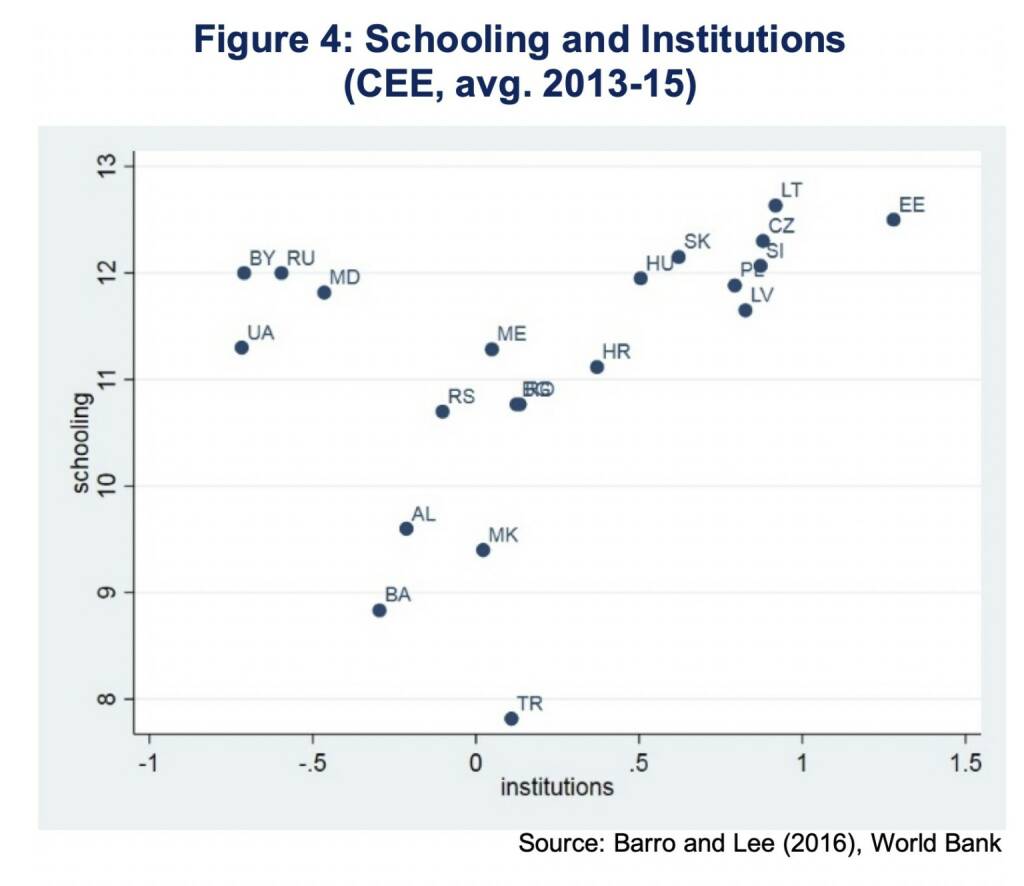
Across the CEE region most EU member states have a favorable combination of institutional quality and education. Countries in Eastern Europe like Ukraine, Russia, Belarus and Moldova perform relatively well with respect to schooling but lack institutional quality. Countries in South Eastern Europe have potential to improve the quality of institutions as well as the human capital of the work force (Figure 4).
Overall, we can conclude that Europe has experienced conditional as well as unconditional convergence during the past 20 years. Convergence was strongest during the immediate pre-crisis period but remained active particularly for the EU in all subperiods. In general, the data show that convergence was faster within the EU compared to Europe as a whole. The CEE economies, which are members of the EU, show particularly strong convergence. Higher quality institutions, a better educated labor force and inflow of foreign direct investment accelerate catch-up growth. Even if uncertainties remain to what extent current EU member states have already had growth-friendly fundamentals prior to gaining EU membership, the evidence presented suggests that the non-EU CEE region would profit substantially from an eastward expansion of the EU. Drawing lessons from current EU member states suggests that frontloading investments in education, improving the quality of domestic institutions and attracting foreign direct investment can lead the way to become a convergence outperformer.
[1]GDP growth and growth projections for the CEE region are based on a nominal GDP weighted average of growth rates in the following economies in which UNIQA operates: Hungary, Poland, Czech Republic, Slovakia, Romania, Ukraine, Bulgaria, Croatia, Serbia, Bosnia and Herzegovina, Kosovo, Montenegro, FYR Macedonia, Albania and Russia, if not stated otherwise.
[2]Solow, R., (1956), A Contribution to the Theory of Economic Growth, Quarterly Journal of Economics, 70(1), 65-94.
[3]Mankiw, N., Romer, D., and Weil, D., (1992), A Contribution to the Empirics of Economic Growth, The Quarterly Journal of Economics, 107(2), 407-437.
[4]The economies covered are: Albania (AL), Austria (AT), Belarus (BY), Belgium (BE), Bosnia and Herzegovina (BA), Bulgaria (BG), Croatia (HR), Cyprus (CY), Czech Republic (CZ), Denmark (DK), Estonia (EE), Finland (FI), France (FR), Germany (DE), Greece (GR), Hungary (HU), Iceland (IC), Ireland (IE), Italy (IT), Kosovo (XK), Latvia (LV), Lithuania (LT), Luxembourg (LU), Malta (MT), Macedonia (MK), Moldova (MD), Montenegro (ME), Netherlands (NL), Norway (NO), Poland (PL), Portugal (PT), Romania (RO), Russia (RU), Serbia (RS), Slovakia (SK), Slovenia (SI), Spain (ES), Sweden (SE), Switzerland (SW), Turkey (TR), Ukraine (UA), United Kingdom (UK).
[5]Barro, R., (2012), Convergence and Modernization Revisited, Paper presented at the Nobel Symposium on Growth and Development, Stockholm, September 3-5, 2012.
[6]Specification 2 of table 1 interacts the initial level of GDP per capita (log) with period dummies. The period between 1998 and 2002 is the omitted reference period. Period specific convergence coefficients can be constructed by adding the reference period coefficient (first row) with the respective period specific coefficient.
[7]Subsequent periods, indicate a positive association with EU membership and convergence as well, though, not to a sufficient extent in order to be statistically significant.
[8]The investment rate is defined as gross capital formation as a share of nominal GDP (Source: Penn World Table). Average annual growth rates of the labor force and total population are taken from the IMF.
[9]In 2016 domestic credit to the private sector was above 100 % of GDP in Cyprus (226 %), Switzerland (175 %), Denmark (170 %), United Kingdom (134 %), Sweden (129 %), Norway (123 %), Netherlands (116 %), Portugal (112 %), Spain (111 %), Greece (109 %), Luxembourg (102 %).
[10]Applying a two-stage-least-square approach with base year values as instruments, except for the initial GDP per capita variable in which case the lag is used, shows consistent results with a convergence coefficient of 2.0 %.
Authors
Martin Ertl Franz Xaver Zobl
Chief Economist Economist
UNIQA Capital Markets GmbH UNIQA Capital Markets GmbH

Latest Blogs
» SportWoche Podcast #124: Liam Ferguson, de...
» Österreich-Depots: Ultimo-Bilanz mit Addik...
» Börsegeschichte 30.8.: Warren Buffett (Bör...
» PIR-News: Zahlen von Warimpex, Strabag, Ne...
» Nachlese: Karin Bauer, LLB Aktien Österrei...
» Wiener Börse Party #727: Nächster Rekord-T...
» Börsenradio Live-Blick 30/8: DAX krönt Erh...
» Börse-Inputs auf Spotify zu u.a. ATX TR, L...
» ATX-Trends: Immofinanz, UBM, CA Immo, S Im...
» Börsepeople im Podcast S14/17: Karin Bauer

Weitere Blogs von Martin Ertl
» Stabilization at a moderate pace (Martin E...
Business and sentiment indicators have stabilized at low levels, a turning point has not yet b...
» USA: The ‘Mid-cycle’ adjustment in key int...
US: The ‘Mid-cycle’ interest rate adjustment is done. The Fed concludes its adj...
» Quarterly Macroeconomic Outlook: Lower gro...
Global economic prospects further weakened as trade disputes remain unsolved. Deceleration has...
» Macroeconomic effects of unconventional mo...
New monetary stimulus package lowers the deposit facility rate to -0.5 % and restarts QE at a ...
» New ECB QE and its effects on interest rat...
The ECB is expected to introduce new unconventional monetary policy measures. First, we cal...