Russia’s economic resilience against sanctions (Martin Ertl)
- The Russian economy weathers financial sanctions amid macroeconomic stability supported by prudent fiscal and monetary policy.
- External debt is well covered by foreign currency reserves.
- The equilibrium real ruble exchange rate has been determined by the terms-of-trade due to oil price fluctuations. Recently, US sanctions might have loosened the exchange rate co-movement with the price of oil.
In June, Russian government debt held by non-residents (OFZ) amounted to 2 trillion rubles (25.6 bn EUR) or 28 % total outstanding ruble-denominated government debt. The share of government debt held by non-residents has been declining (34 % in January). The total outstanding nominal of Eurobonds (securities issued in hard currency in the international bond markets) amounts to 31.4 bn EUR with 2.2 bn repayable until end 2019. Hence, total externally held public debt (RUB and foreign currency) adds up to around 57 bn EUR (roughly equivalent to the number released by the Ministry of Finance for July). External debt coverage by FX reserves is generally very high. External government debt as well as total short-term external debt are below 20 % and total external debt is around 130 % of FX reserves.
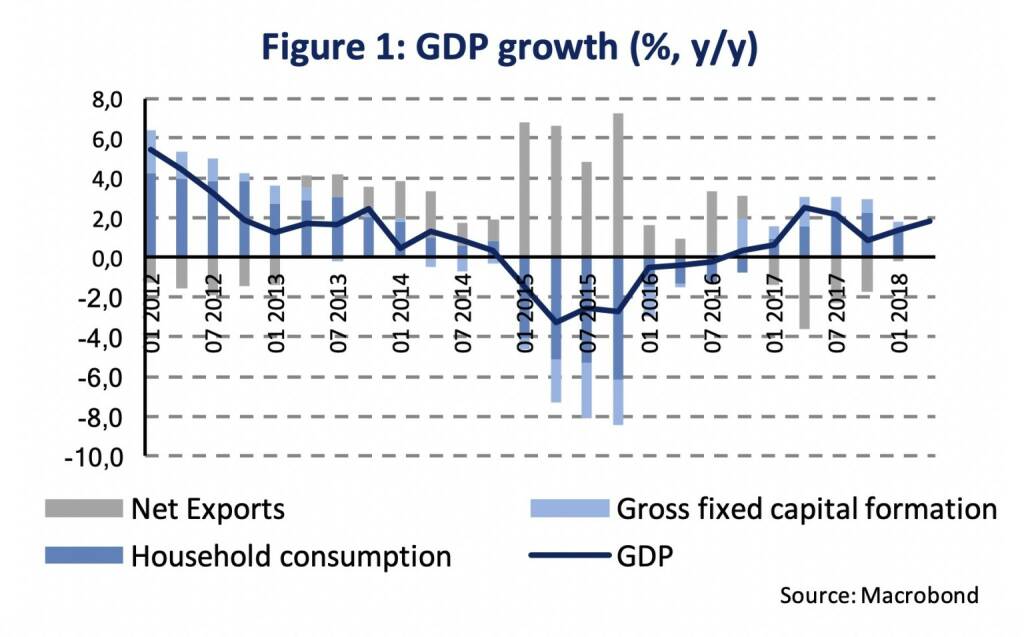
Economic growth accelerated gradually during the first half of the year (Figure 1). According to the 1st estimate (released last week), the real GDP expanded by 1.8 % annually (after 1.3 % during Q1). In seasonally-adjusted terms (own calculation), the Q2 GDP increase was 1.1 % compared to the previous quarter indicated a quarterly growth acceleration (1.6 % in y/y-terms). The Q2 speed-up in GDP growth implies upside risk to our GDP forecast (1.7 %) for the total of 2018.
Previously, in Q1, growth was driven by domestic demand with household consumption and fixed investment rising by 2.7 % and 1.8 % (y/y). Q2 details for expenditure components are not yet released.
Economic policy is conservative and prudent both with respect to fiscal and monetary policy. In June, the 12 months average of the federal budget deficit declined to 1.0 %. The fiscal rule regards any oil & gas income in excess of the one corresponding to a price of oil at 40 USD/bl as unsustainable (Urals oil averaged around 65 USD/bl year-to-date). Excess oil income is transferred to the National Wellbeing Fund which increased from 65.2 bn USD to 77.2 bn since December. The government’s budget plan envisaged a deficit of 1.3 % for 2018.
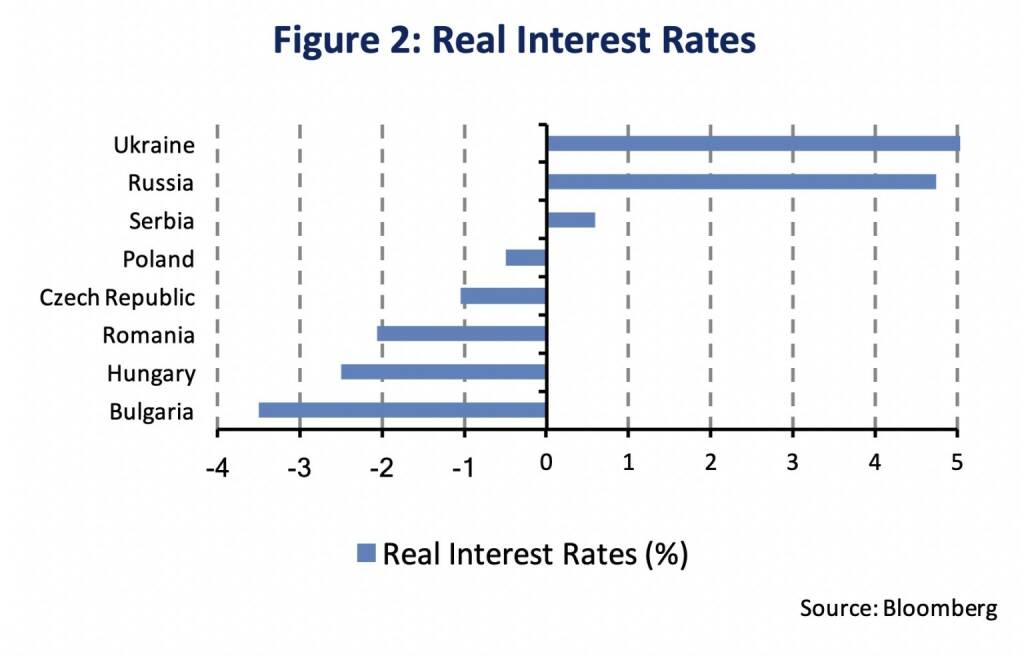
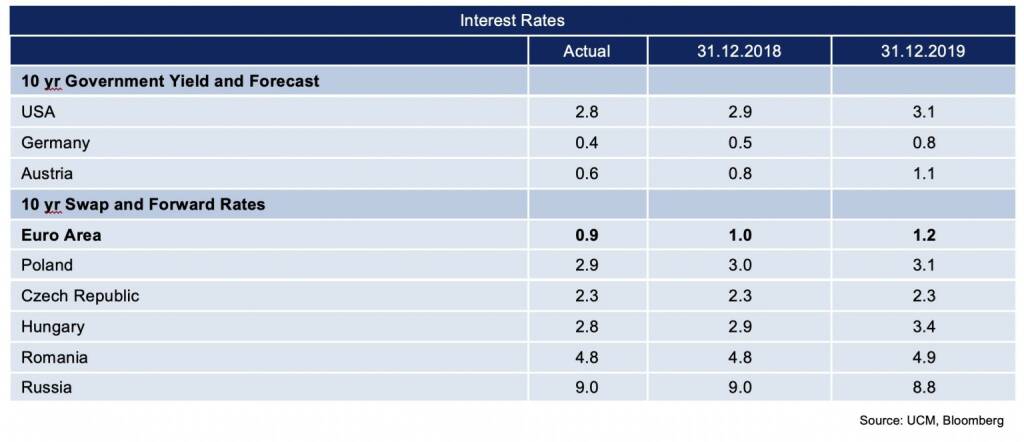
The Central Bank of Russia (CBR) switched to an inflation-targeting regime whereby the inflation target is 4 %. The consumer price inflation rate has been very low recently (2.4 % in April). The central bank has already turned cautious in the previous meetings indicating “proinflationary risks” due to the tax measures (value-added tax increase) and external conditions (statement as of July 27th). The CBR forecasts inflation of 3.5 to 4 % at the end 2018 and a temporary overshoot of the inflation target (4 %) due to the tax increase in 2019. The key policy rate is maintained at a high level of 7.25 % leaving Russia with one of the highest real key interest rates in the region (Figure 2).
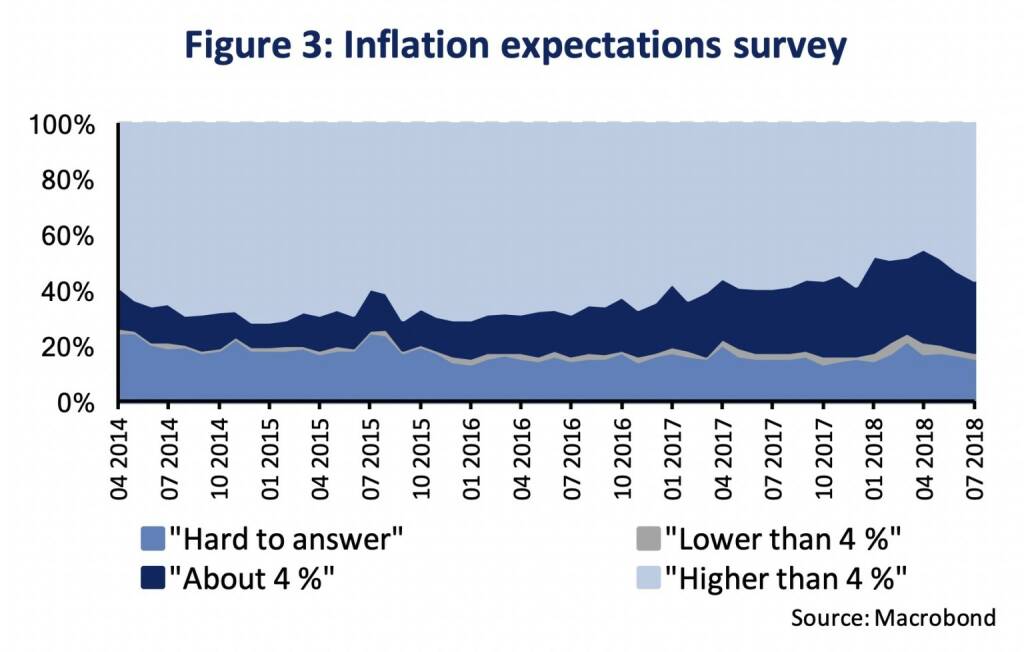
Given the CBR’s switch towards an inflation-targeting framework, inflation expectations had increasingly appeared anchored around the target. In its statement, the CBR highlighted uncertainty due to the effect of the tax measures on inflation expectations, what might be reflected in the surveys of the last three months (Figure 3). The part of survey-respondents expecting inflation “about 4 %” has decreased (26 % after 34 % in April).
The ruble depreciated around 6 % versus the USD following rumors about renewed US sanctions. FX pass-through of inflation has traditionally been high in Russia. We estimate an impact of a 10 % depreciation of around 0.3 % on quarterly inflation. For long-term quarterly data since 1998, we estimate an elasticity of 1.3. A one percent depreciation against the USD is associated with a 1.3 percent rise in consumer prices. The large effect (greater than one) suggests historical inflation mechanisms in addition to the direct effect rising import prices. The elasticity might have decreased with the new monetary policy regime (f. ex. due to lower inflation expectations). Rising foreign currency reserves have (from 356.1 bn to 380.6 bn USD since December, excluding the National Welfare Fund) support the stability of the currency.
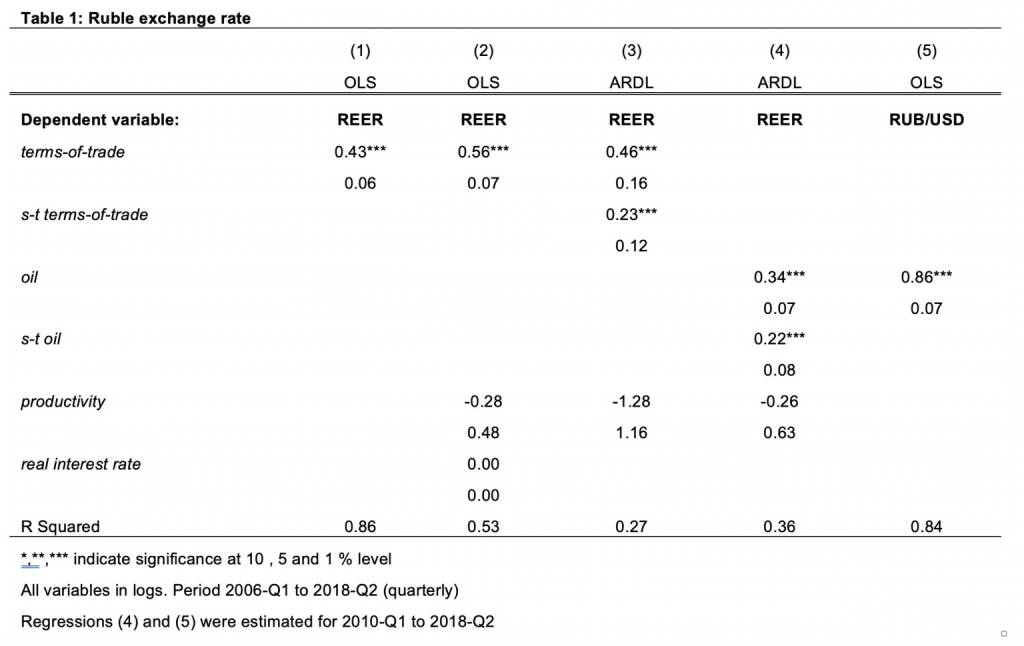
The price of oil has a significant effect on exchanges rates in oil-dependent countries. The long-run equilibrium real effective exchange (REER) is determined by the terms-of-trade (ToT). The REER is the nominal effective exchange rate vis-à-vis a trade-weighted currency basket adjusted for the relative price development vis-à-vis the trading partners. The ToT are defined as the prices of exported goods relative to the prices of imported goods. For energy exporting countries, a 10 % rise in the ToT was found to increase the REER by 2.8 % (Dauvin, 2013) [1]. For Russia, the ToT would be strongly determined by the price of oil. A 10 % rise in the real price of oil (oil in USD adjusted for US inflation) is associated with an increase in the REER between 4 and 8 % (Korhonen and Juurikkala, 2007). [2]
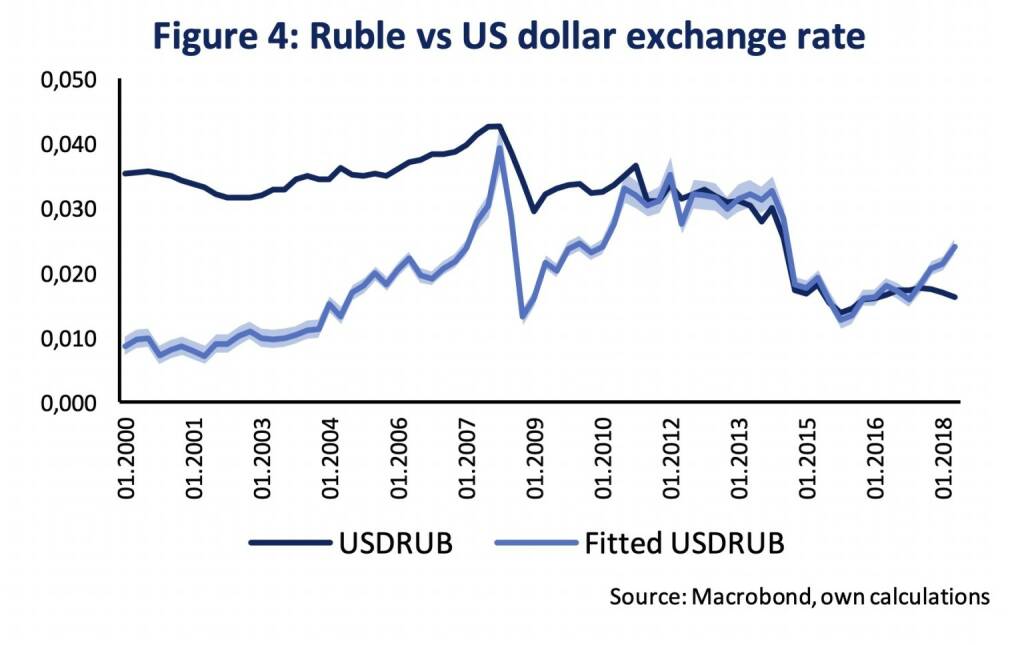
We replicate some of the regressions in the mentioned literature and confirm a statistically significant relationship between the terms-of-trade and the real effective exchange rate (Table 1). In OLS regressions ((1) and (2)), a rise of 10 % in the ToT is statistically significant associated with an increase in the REER between 4.3 % and 5.6 %. Note that neither the differential between real short-term US and Russian interest rates (real interest rate) nor the relative productivity development versus the US (productivity) have a statistically significant impact on the exchange rate. The autoregressive distributed lag model (ARDL) captures long-run relationships as well as short-term adjustment processes more properly (model (3)). A 10 % rise in the ToT relates to an increase by 4.6 % in the REER. The short-term, adjustment coefficient (s-t terms-of-trade) indicates that a one %-age point change in the ToT leads to a rise of 0.23 % in the REER. The ARDL also suggests a long-term cointegration between the REER and the price of oil (model (4)) with a gradually smaller coefficient (0.34). We cannot detect a long-run cointegrated movement of oil and the nominal ruble exchange rate against the US dollar (RUB/USD). However, since 2010, the RUB/USD seems to link strongly to changes in the oil of price (model (5)). An increase of 10 % in the price of oil leads to a statistically significant rise in RUB/USD of 8.6 %. The increase in the statistical fit in the model might relate to the abandonment of the managed exchanged rate regime by the Russia central bank (CBR) in 2015. Figure 4 shows the actual RUB/USD exchange rate and the exchange rate that is predicted by the model. The significant divergence in the fitted exchange rate and the actual exchange rate since early in the year suggests that the intensification and threat of US sanctions has led the ruble exchange rate to depart from the strong co-movement with the price oil.
Financial sanctions can be compared to a financial shock hitting the economy. Restricted foreign demand for Russian securities leads to financial outflows and depreciation pressure on the ruble and higher yields. Lower ruble affects inflation and higher inflation, in turn leads to higher yields in the domestic economy. Higher real yields are contractionary for the economy. The Russian economy weathered the financial sanctions quite well so far amid macroeconomic stability supported by prudent fiscal and monetary policy, while the ruble has suffered.
[1] Dauvin, M. (2013): „Energy Prices and the Real Exchange Rate of Commodity-Exporting Countries”, Nota di Lavoro, Fondazione Eni Entrico Mattei
[2] Korhonen, I. and T. Juurikkala (2007): „Equilibrium Exchange Rates in Oil-Dependent Countries “, BOFIT Discussion Papers 8
Authors
Martin Ertl Franz Zobl
Chief Economist Economist
UNIQA Capital Markets GmbH UNIQA Capital Markets GmbH
Latest Blogs
» Wiener Börse zu Mittag leichter: FACC, Baw...
» Börsenradio Live-Blick 28/10: DAX gut in K...
» ATX-Trends: Agrana, DO&CO, Verbund ...
» Börsepeople im Podcast S15/14: Oliver Bacher
» Börse-Inputs auf Spotify zu u.a. Thomas Mu...
» SportWoche Podcast #132: Bei Thomas Muster...
» Börse-Inputs auf Spotify zu traurige Gewin...
» Wiener Börse Party #767: (M)ein ernüchtern...
» Österreich-Depots: Weekend-Bilanz (Depot K...
» Börsegeschichte 25.10.: CAI, Martin Grüll,...

Weitere Blogs von Martin Ertl
» Stabilization at a moderate pace (Martin E...
Business and sentiment indicators have stabilized at low levels, a turning point has not yet b...
» USA: The ‘Mid-cycle’ adjustment in key int...
US: The ‘Mid-cycle’ interest rate adjustment is done. The Fed concludes its adj...
» Quarterly Macroeconomic Outlook: Lower gro...
Global economic prospects further weakened as trade disputes remain unsolved. Deceleration has...
» Macroeconomic effects of unconventional mo...
New monetary stimulus package lowers the deposit facility rate to -0.5 % and restarts QE at a ...
» New ECB QE and its effects on interest rat...
The ECB is expected to introduce new unconventional monetary policy measures. First, we cal...