The comparative economic development of Serbia and Kosovo (Martin Ertl)
- Serbia made comparably more economic progress than Kosovo, but both countries underperform with respect to income convergence in Eastern Europe.
- Recently, both countries had a solid recovery. Serbia‘s recovery is boosted by construction. The current GDP growth rate is likely not sustainable but the macro environment remains sound.
- Foreign remittances, rising wages and lending growth support consumption in Kosovo.
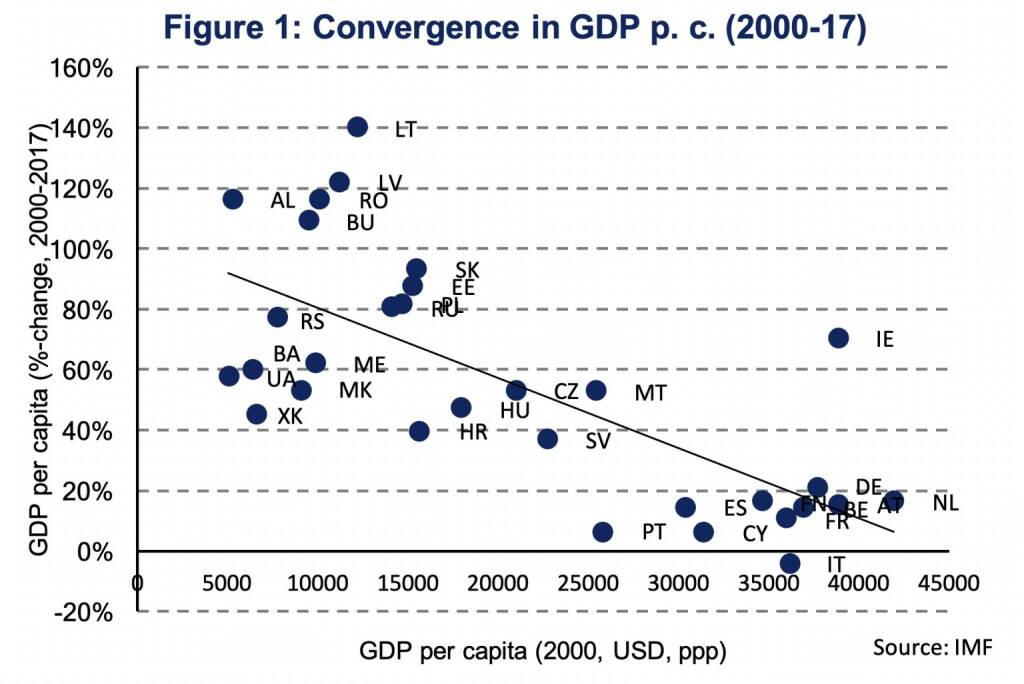
Central and Eastern Europe (CEE) makes substantial progress in closing the income gap relative to Western Europe. Figure 1 shows the level of per capita gross domestic product (GDP p. c.) in 2000 and the percentage change between 2000 and 2017. Countries with lower GDP p. c. exhibit higher growth rates. After the dissolution of the Socialist Federal Republic of Yugoslavia in the 1990s, some of the successor states – Croatia (HR), Bosnia & Herzegovina (BA), Kosovo (XK), Macedonia (MK), Montenegro (MT) and Serbia (RS) – had lower living standards than most European countries and made slower progress in converging towards Western European income levels (lower-left part of figure 1). Serbia had a per capita GDP of 7,800 USD in 2000 which increased by 77.7 %. Kosovo’s population was poorer (6,500 USD p. c. GDP) and made less catch-up progress (45 %).
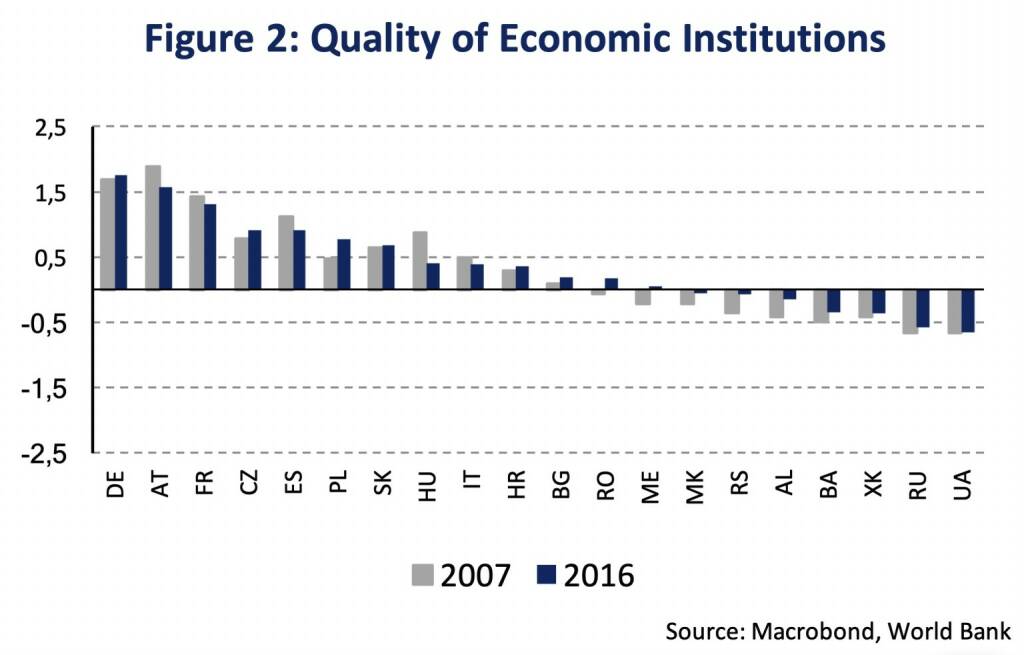
In 2017, Serbia’s GDP p. c. was 30 % compared to Germany, while Kosovo’s GDP p. c. was 21 % compared to Germany’s standard of living. One reason for slow convergence is low quality of economic institutions. According to the World Governance Indicators (World Bank), Kosovo’s institutional quality is almost unchanged since 2007 (earliest available data) and Serbia improved the quality of its economic institutions, while still both states have weak institutions compared to not only Western European but also most CEE countries (Figure 2).
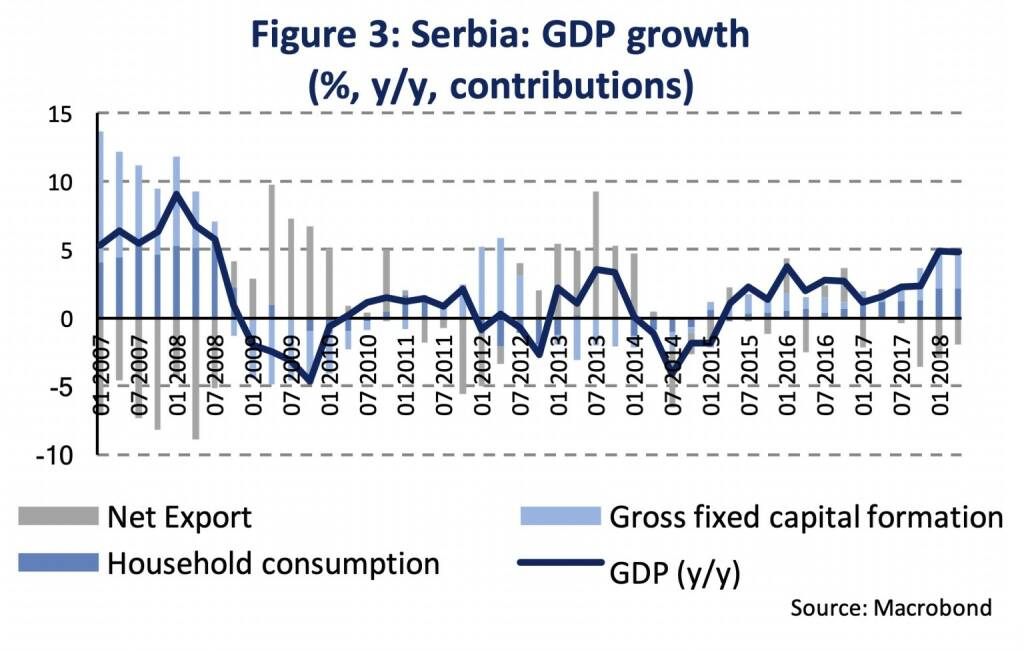
While the long-term catch-up potential remains high, Serbia and Kosovo had solid business cycles in recent years. In Serbia, economic growth has been accelerating during the first half of 2018 (Figure 3). Growth picked up to 4.9 % during H1, after GDP had risen by 1.9 % last year. The acceleration was induced by rising domestic demand. In Q2 2018, household consumption increased by 3.1 % and gross fixed investment rose strongly by 12.1 % (y/y). Exports and imports are growing (7.1 % and 9.2 % y/y) albeit the net contribution of exports to GDP growth has been negative.
On the supply side of Serbia’s economy, a large boost came from the construction sector which grew by 22.9 % (y/y) in Q2. Agricultural output – usually volatile and weather-dependent – also contributes to growth (14.8 % y/y). However, both factors are likely temporary growth drivers. In addition, the manufacturing, the wholesale and retail trade and public administration sectors contribute significantly to output growth. Although the macro environment is set to remain favorable, the current growth rate might not be sustainable in the medium-term. We project real GDP to grow by 4.0 % and 3.2 % in 2018 and 2019.
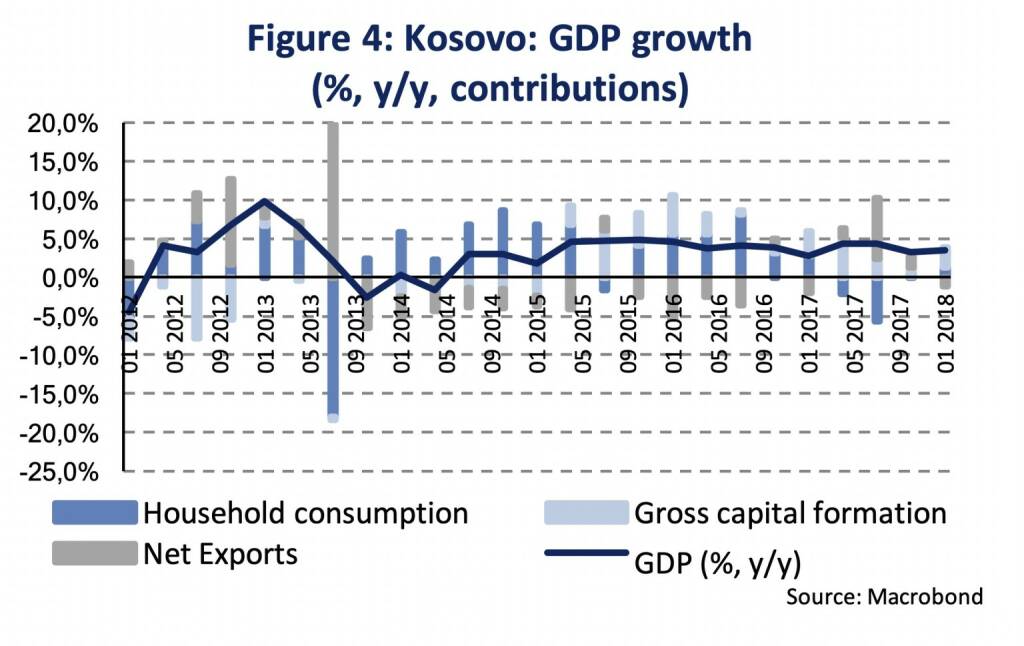
Kosovo’s real GDP (Figure 4) increased by 3.5 % in Q1 2018, after it had expanded by 3.7 % in 2017. Household consumption expands slowly 1.4 % (y/y), while fixed investment accelerated since last year (10.0 % y/y). Growth in exports, which appeared elevated last year (21.3 %), slowed in Q1 (16.2 %). The growth contribution from net exports to GDP turned negative (-1.1 %) amid sustained high import growth (7.8 %). Monthly real exports growth (adjusted for CPI inflation) turned negative in March and fell to -10.5 % until July. Imports grew by 13.8 % in the same month. The monthly data suggest a rising drag of net exports on GDP growth. In particular, high volumes of raw materials were exported during last year and the growth rate might not be sustained in 2018. Foreign remittances support economic development in Kosovo. In Q1, remittances amounted to 170 mln EUR (+4.3 % y/y). Currently, GDP growth is of comparable magnitude in Serbia and Kosovo. For Kosovo, we project real GDP to increase by 3.5 % this year and in 2019.
The conditions in the labor markets are improving in Serbia and Kosovo. Serbia’s unemployment rate (15 yr+) was 11.9 % in Q2. Employment has been expanding solidly (+3.2 % y/y in July) and real wages have been rising (4.0 % y/y in June). In Kosovo, unemployment is significantly higher (26.5 %), though it has also decreased recently (from 30.5 % in 2017). Official employment is very low. according to labor force statistics, there were 344,800 employed persons in Q1 2018, whereas the total population is around 1.9 million persons. Average monthly net wages (June) amounted to 417 Euro in Serbia and 526 Euro in Kosovo (gross wages were similar). Wages exhibited a considerable rise of 15.4 % in Kosovo providing support to household demand.
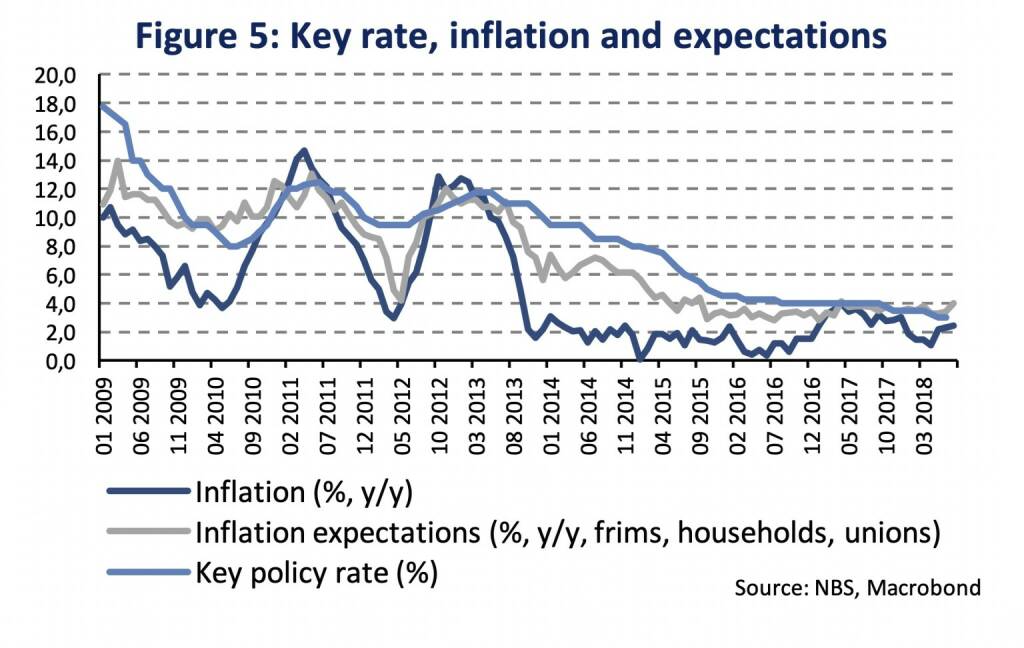
Price trends in Serbia are benign and interest rates are now relatively low. Main upside risks to prices stem from international developments. Consumer prices have been gradually accelerating in Q2 and Q3 (2.4 % y/y) amid rising food & beverage (contributing 1.2 % to overall inflation) and energy (0.34 %) prices as well as rising core inflation (0.9 %-age points contribution). The inflation rate has moved into the target band (3 % +/- 1.5 %-age points) of the National Bank of Serbia (NBS). According to the NBS projection, inflation will remain in the tolerance band until end-2019. The inflation rate will likely keep rising until end-2018 to average 2.7 % over the total of the year. Private inflation expectations appear well anchored around the inflation target.
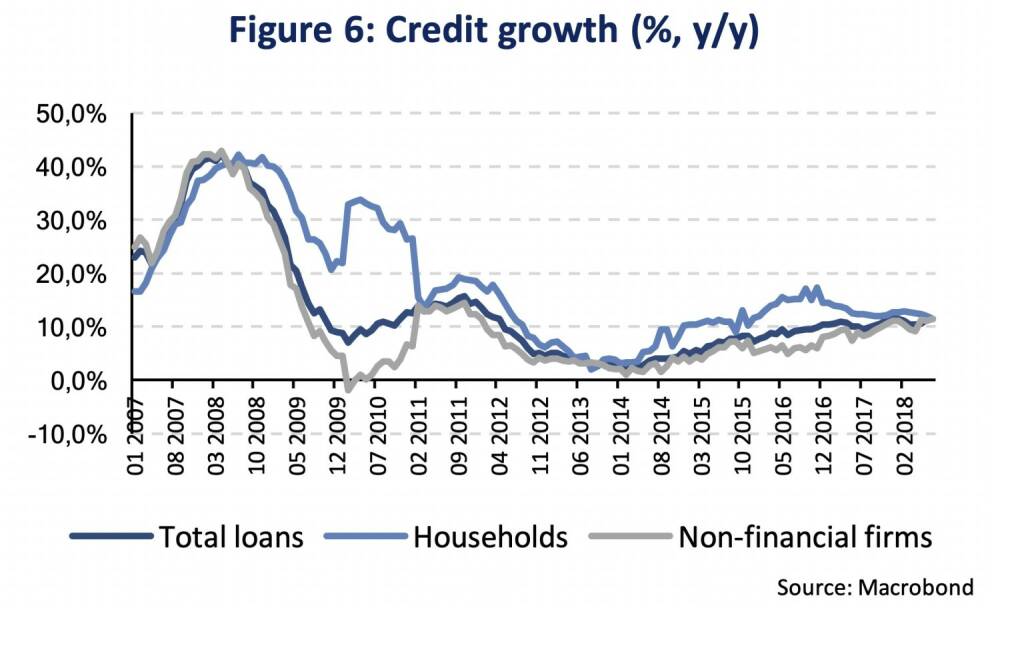
In Kosovo, consumer price developments have also been slow. The consumer price inflation inched up gradually during this year to 1.5 % (y/y) in August. The banking sector is characterized by an accelerated increase in credit activity (Figure 6). Bank lending has been growing at an elevated rate for some time (11.4 % y/y in August) similarly supported by household as well as corporate lending. Lending interest rates for new loans averaged 6.7 % in July. Household deposit creation is accelerating (+10.5 % y/y in July). Financial development fosters economic development in Kosovo
We highlight growth and development prospects in Serbia and Kosovo. Kosovo remains among the poorest countries in South Eastern Europe. Both economies have leeway to converge in income. Weak economic institutions might be one factor slowing economic development. On the other side, the short-term cycles paint a fairly sound picture with growing economic activities, gradual improvements in the labor markets and low inflation environments.
ECB update on QE, growth and inflation
- Net purchases will be further reduced in October and end by year-end. The accumulated stock continues to provide an ample degree of monetary stimulus.
- New staff projections show slightly lower GDP growth and gradually rising core inflation. Core inflation might pick-up in Q4 if following historic seasonal patterns.
Last week’s meeting of the ECB’s Governing Council was well in line with expectations. As previously announced, the net purchases under the asset purchase program (APP, also known as QE) will be further reduced to 15 billion EUR in October with the objective to end net purchases by year-end. However, that’s not the end of QE. The stock of acquired assets will be further reinvested, thus, providing significant monetary policy stimulus to support the sustained convergence of inflation to levels that are below, but close to, 2 % over the medium term. Until August 2018 the ECB has accumulated a stock of 2,510 billion EUR of assets under the APP, which will grow to 2,585 billion EUR until the end of the year and is anticipated to stay constant thereafter. The total ECB balance sheet has more than doubled since the start of APP in Q4 2014 and the share of securities held for monetary policy purposes has increased to 56 % in early September 2018 (Figure 6). A timeline for a possible reduction of the ECB balance sheet has not yet been communicated and reinvestment is intended to last “for as long as necessary to maintain favorable liquidity conditions and an ample degree of monetary accommodation” (ECB statement, September 2018). In the United States, the Federal Reserve Bank has initiated a balance sheet reduction in October 2017, three years after the end of the bond-buying program.
The normalization of monetary policy in the Euro Area remains conditional on incoming data confirming the ECB’s medium-term inflation outlook as published quarterly in the ECB’s staff macroeconomic projections. The new projections from September 2018 show only marginal changes to the ECB’s growth and inflation outlook. GDP growth has been lowered by 0.1 %-points for the years 2018 (2.0 %) and 2019 (1.8 %). Inflation has been kept constant for 2018 at 1.7 % (headline inflation) and 1.1 % (core inflation). For the years 2019 and 2020 core inflation was lowered by 0.1 %-age points to 1.5 % (2019) and 1.8 % (2020). The ECB assesses the newly released September 2018 staff macroeconomic projections as broadly confirming the previous assessment of an ongoing broad-based expansion of the Euro Area economy and gradually rising inflation.
The economic expansion of the Euro Area has lost some pace during the first half of 2018 growing at 0,4 % per quarter after 0,7 % average quarter-on-quarter growth in 2017. Keeping the current pace at 0,4 % quarter-on-quarter growth for the third and fourth quarter of 2018 is consistent with the ECB’s GDP projection of 2.0 %. GDP growth of 1.8 % in 2019, however, suggests a growth rebound in 2019 to quarterly growth of just below 0.5 %. Keeping the current pace of 0.4 % quarter-on-quarter growth would result in growth at 1.6 % in 2019. In spite of the slowdown of growth, the Euro Area expands at or slightly above its potential growth rate of 1.4 % (OECD) or 1.5 % (European Commission, AMECO). The reason for slower growth in 2017 is weaker than expected export performance while domestic demand remains strong. Figure 8 shows GDP growth being decomposed by expenditure including a projection for 2018 which assumes expenditure components to grow at the same quarterly pace in H2 as in H1 2018. While net exports contributed significantly to GDP growth in 2017 it is non-existent in 2018. Seasonally adjusted quarter-on-quarter export growth of goods and services was 0.6 % in Q2 and even negative at -0.7 % in Q1. The long-term average is at 1 % (since 2002). Investment growth, however, is projected to accelerate in 2018 compared to the previous year, compensating partly for slower export growth.
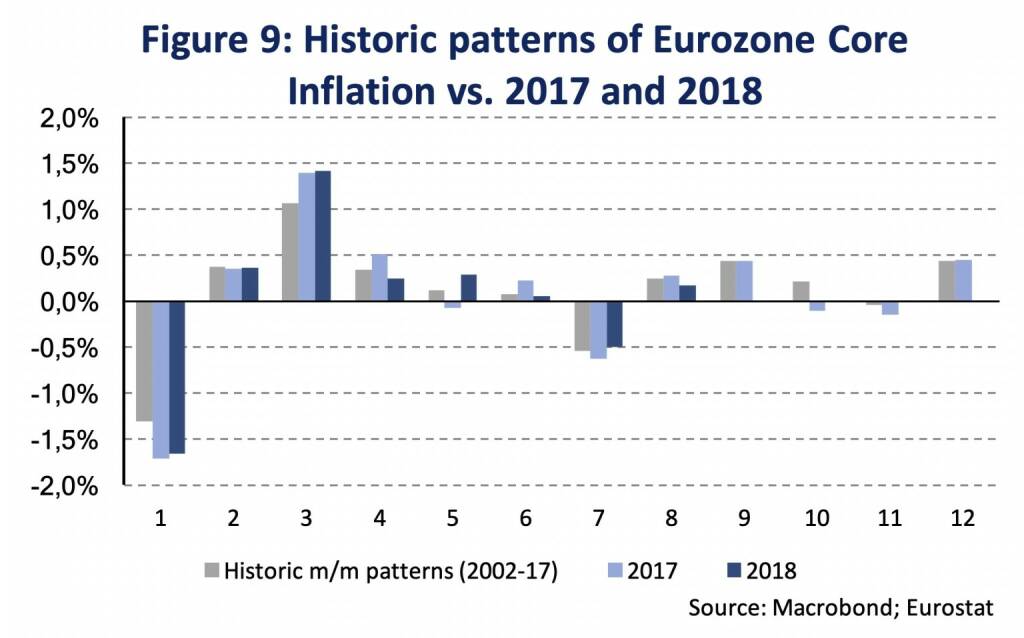
Core inflation remains subdued but might pick-up soon. The latest reading from August shows core inflation at 1.0 % after 1.1 % in July. Core inflation has remained rather flat for at last the past year and a backward looking moving average, which is anchored in August 2018, only falls below 1 % when going further back than May 2016. However, applying seasonal patterns to project core inflation suggests an increase of close to 1.4 % as early as Q4 2018. This is also consistent with the ECB’s staff projection of 1.1 % for the whole year of 2018. Figure 2 shows that monthly growth rates of HICP core inflation in 2018 have been broadly in line with their historical averages. In 2017 month-on-month price changes have been deflationary, also compared to the historic averages, in October and November.
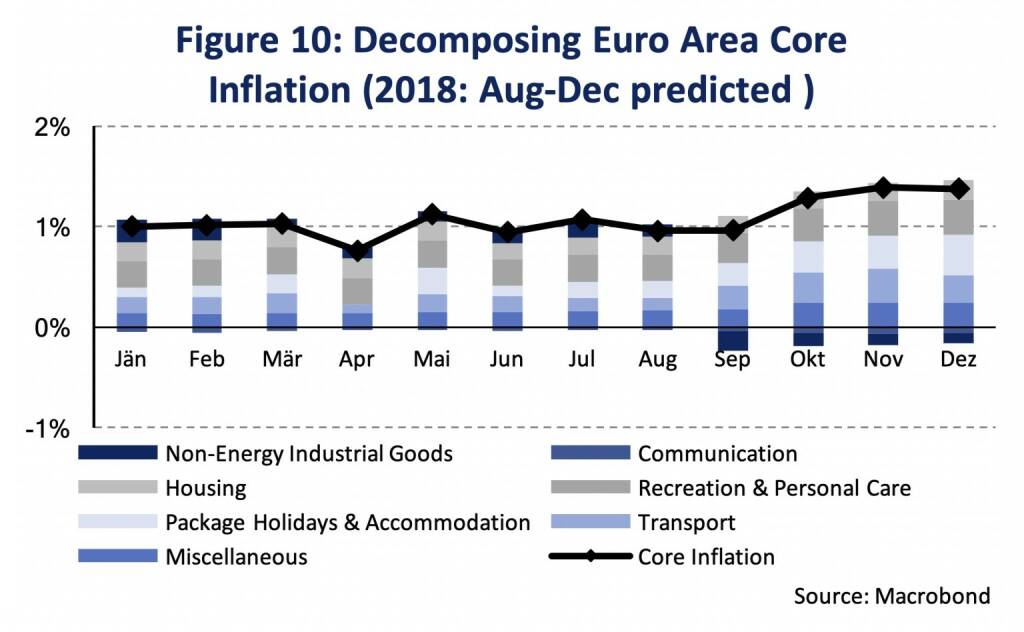
Looking at components of Euro Area core inflation shows that the projected pick-up is mainly driven by the prices of services, rather than non-energy industrial goods. More specifically, package holidays & accommodation is identified as the single most important factor to lift aggregate prices during the upcoming quarter. Transport related services as well as recreation and personal care are additional services which would contribute to the increase in core inflation, given that they follow their seasonal patterns (Figure 10).
Overall, it can be concluded that the medium-term macroeconomic outlook by the ECB has not changed materially since the last macroeconomic projections in June. GDP growth is slightly lower but consistent with the current pace of the expansion. Inflation is expected to increase gradually over the medium-term. Base effects in core inflation, linked to transport and tourist related service prices, might cause a pick-up in core inflation as soon as Q4 2018 if historic seasonal patterns materialize.
Authors
Martin Ertl Franz Zobl
Chief Economist Economist
UNIQA Capital Markets GmbH UNIQA Capital Markets GmbH


Latest Blogs
» BSN Spitout Wiener Börse: Mit Erste, Bawag...
» SportWoche Party 2024 in the Making, 23. A...
» SportWoche Party 2024 in the Making, 25. A...
» Österreich-Depots: Unverändert (Depot Komm...
» Börsegeschichte 25.4.: RBI, Porr (Börse Ge...
» Zahlen von Strabag, News von Marinomed, S ...
» Wiener Börse Party #637: Egalite Addiko Ba...
» Nachlese: Marcel Hirscher, Hannes Roither,...
» Wiener Börse zu Mittag schwächer: Frequent...
» MMM Matejkas Market Memos #35: Gedanken üb...

Weitere Blogs von Martin Ertl
» Stabilization at a moderate pace (Martin E...
Business and sentiment indicators have stabilized at low levels, a turning point has not yet b...
» USA: The ‘Mid-cycle’ adjustment in key int...
US: The ‘Mid-cycle’ interest rate adjustment is done. The Fed concludes its adj...
» Quarterly Macroeconomic Outlook: Lower gro...
Global economic prospects further weakened as trade disputes remain unsolved. Deceleration has...
» Macroeconomic effects of unconventional mo...
New monetary stimulus package lowers the deposit facility rate to -0.5 % and restarts QE at a ...
» New ECB QE and its effects on interest rat...
The ECB is expected to introduce new unconventional monetary policy measures. First, we cal...