Have we seen the peak of the business cycle? (Martin Ertl)
- GDP growth slowed down both in the United States (0.6 %, q/q, sa) and the Eurozone (0.4 %).
- Sentiment indicators remain elevated in spite of recent declines.
- US unemployment rate has decreased further (3.9 %) while hourly earnings growth has remained constant (2.6 %).
- Inflationary pressure is emerging in the United States but remains moderate in the Euro Area.
- Monetary policy continues to be accommodative, particularly in the Euro Area.
The United States and the Eurozone have lost some growth momentum in early 2018, as recently released GDP figures have revealed. GDP growth in the United States was 2.3 % (q/q, annualized) in Q1 2018 after 2.9 % in Q4 2017 and 2.6 % for the whole year of 2017. The Eurozone expanded by 0.4 % (q/q, sa), or 2.5 % (y/y, sa), in Q1 2018 after three consecutive quarters at 0.7 % quarter-on-quarter growth. In 2017 the Eurozone economy grew at 2.5 %. Our GDP-Tracker (Nowcast) for the Eurozone, which indicated growth to slow down to 0.4 % in Q1 2018, points towards growth at 0.4 % also in Q2 2018. For the U.S. economy, Nowcasts by the Federal Reserve Bank of New York (3.2 %) as well as Atlanta (4.1 %) indicate growth to accelerate again in Q2 2018, based on increased consumer spending.
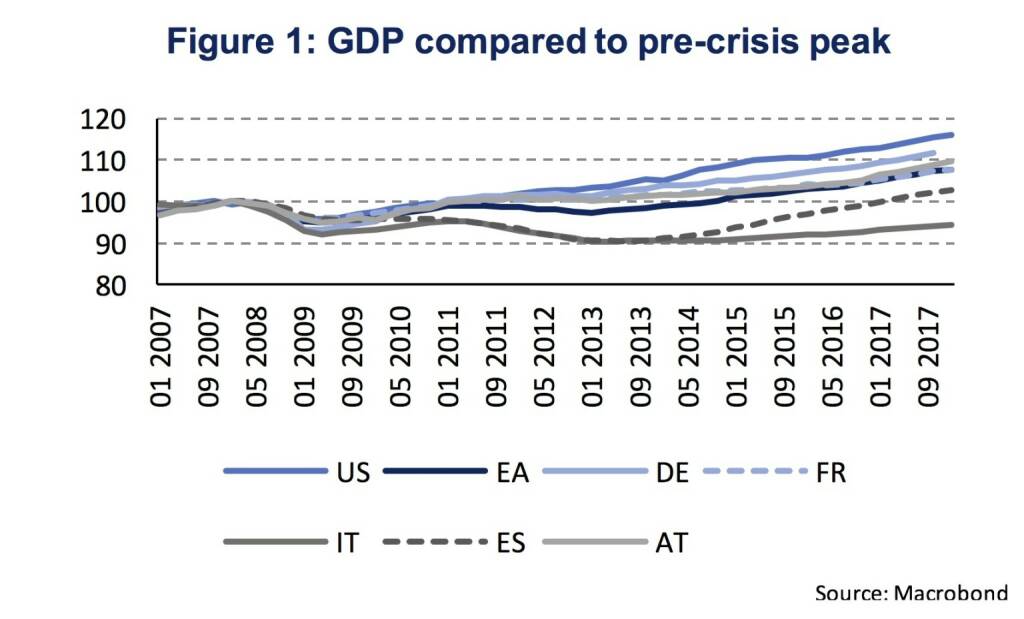
Among the Euro Area member states, Spain continues a solid recovery at 0.7 % (q/q, sa) growth. The French economy, which grew at the same speed as Spain in Q4 2017 (0.7 %), fell back in Q1 2018 with a growth rate at 0.3 %. Italy continues to expand only very slowly at 0.3 %. In Austria growth momentum remains strong at 0.7 %, though having decelerated from 0.9 % in Q4 2017. Germany has not released GDP figures for Q1 2018 yet. Among those Eurozone countries, it should be noted that only Italy remains below the pre-crisis GDP peak. The Eurozone stands at 8 %, Germany at 12 %, Austria at 10 %, France at 8 %, Spain at 3 % and Italy at -6 % above/below the peak of GDP ten years ago. The United States stands at 16 % above the pre-crisis peak in GDP in Q4 2007 (Figure 1).
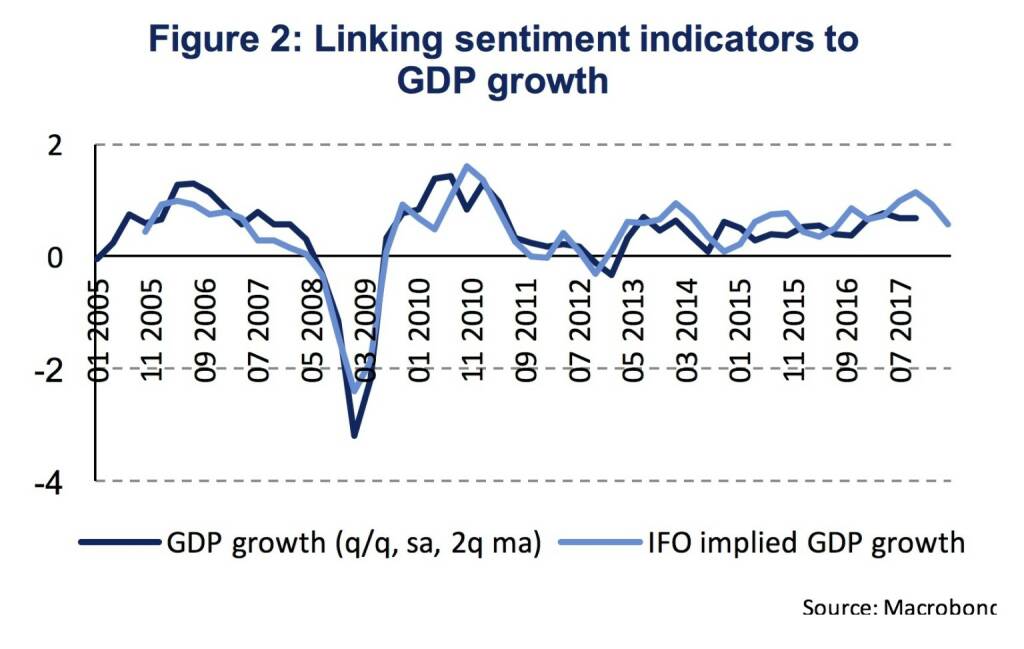
As quarter-on-quarter growth rates continue to be positive, the peak of the business cycle has not been reached yet. The evidence suggests that growth is decelerating, hence, growth momentum is declining. Nevertheless, the expansion remains solid and strong, particularly in Austria, Spain and probably also Germany. The recent growth slow-down has already been heralded by decreasing sentiment indicators, which now seem to stabilize at a high level. The current level of the German Ifo Business Climate Index at 102.1 (April, sa) still indicates quarter-on-quarter GDP growth at 0.6 % (Figure 2).
So, when will the business cycle turn? There is no clear periodicity to business cycles. Economic theory sees business cycles as being originated by random shocks (real business cycle theory). Empirically, causes of recessions can be manifold and do often not occur in isolation. For instance, excessive contractionary monetary or fiscal policy can lead to a fall in demand and so lead to a recession. Moreover, investment and consumption might also be reduced due to difficulties in meeting debt obligations after periods of rapid debt accumulation, like prior to the last financial crisis. Alternatively, external factors might cause a recession such as severe disruptions of trade links.
Based on the National Bureau of Economic Research’s (NBER) Business Cycle Dating Committee, the current U.S. expansion lasts for 106 months (06/2009-03/2018). There have been 12 post-recession periods in the post-World War II U.S. history. Only the growth period between 1991 and 2001 lasted longer (120 months) than the current expansion. The average period between two recessions has been close to 5 years (58 months). Hence, the length of the current expansion has already passed the historical average, yet needs to last more than one year longer to surpass the longest post-recession period. Hence, the historical evidence does not necessarily indicate the next recession to be imminent. Based on currently available data, economic growth remains solid but might not accelerate further.
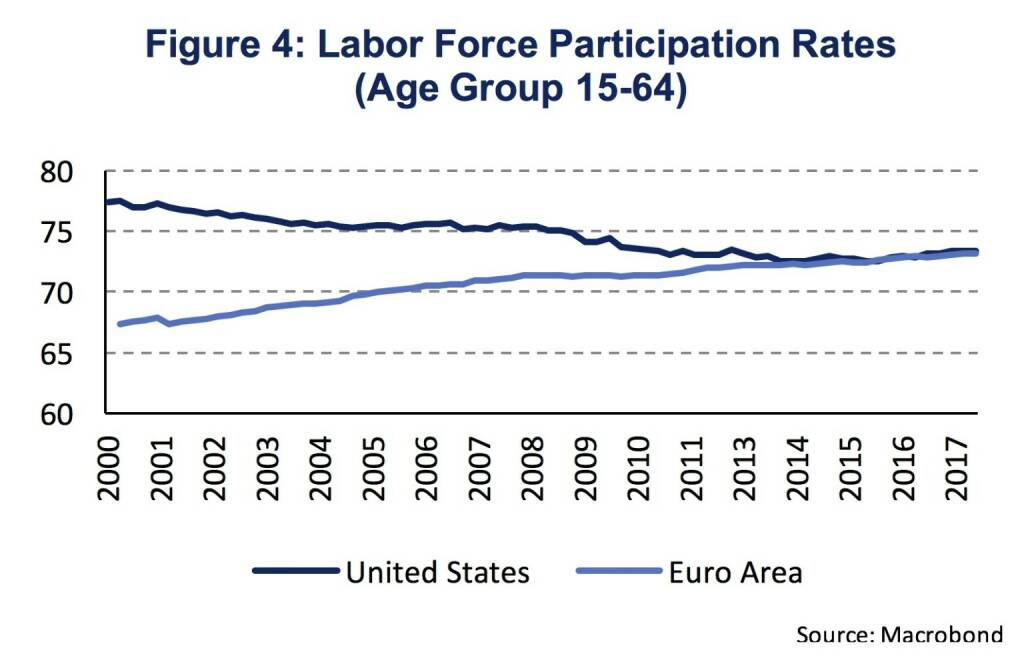
The economic expansion has, so far, been characterized by low inflation and moderate wage growth in spite of tightening labor markets. The latest employment report (April) by the U.S. Bureau of Labor Statistics (BLS), shows that the unemployment rate has declined to 3.9 % after 6 months at 4.1 %. The participation rate for the age group 16+ declined by 0.1 %-age points to 62.8 %. The participation rate for the age group 16-64 stayed constant at 73.5 % with no trend increase observable during the last few months. The same holds for the growth of average hourly earnings. In April, average hourly earnings increased by 2.6 % (y/y) which is equal to the average monthly growth rate since January 2017. Hence, wage growth remains moderate even though the unemployment rate has further declined and stays below the level in 2007 at 4.6 %. In the Euro Area, the unemployment rate remains elevated at 8.5 % which is above its pre-crisis level (2007: 7.5 %) even though it has already declined significantly since 2013 (12 %). The labor force participation rate follows a long term upward trend having reached 73.2 % in Q4 2017. Labor force participation rates between the United States and the Euro Area have converged (Figure 4).
Self-sustaining inflationary dynamics have yet to emerge, particularly in the Euro Area. The ECB staff macroeconomic projections for the Euro Area (March 2018) show a slow and gradual convergence in core inflation (HICP excluding energy and food) close to the ECB’s inflation aim at 2 %. Core inflation, which is most relevant for monetary policy decision making, is projected at 1.1 % in 2018, 1.5 % in 2019 and 1.8 % in 2020. The latest reading of 0.7 % (April) was below what would have been implied by the ECB macroeconomic projection. In April core inflation decreased due to weaker growth in prices of services (1.0 %). Headline inflation at 1.2 % (April) is, however, still in line with the ECB’s projection of 1.4 % for 2018. With respect to monetary policy, the ECB sees “an ample degree of monetary stimulus […] necessary for underlying inflation pressures to continue to build up and support headline inflation developments over the medium term”, as being stated in the introductory statement of the ECB’s press conference after the monetary policy meeting on April 26. In June the ECB will publish new macroeconomic projections and potentially change its forward guidance regarding the net asset purchases which run until the end of September 2018 at the current monthly pace of 30 bn EUR.
In the US, inflation shows more momentum. Core inflation has picked up to reach 1.9 % in March 2018 compared to 1.6 % in February. According to the economic projections of the Federal Reserve Board members (March 2018), core inflation is expected to reach 1.9 % in 2019, 2.1 % in 2019 and 2.1 % in 2020. The latest statement by the Federal Open Market Committee (May 2nd) shows changes to its wording regarding inflation. The assessment of developments of core inflation has been altered to “inflation for items other than food and energy have moved close to 2 percent” from previously “continued to run below 2 percent”. Moreover, inflation is expected to “run near the Committee’s symmetric 2 percent objective over the medium term”. Hence, the FOMC emphasizes that inflation running persistently above, or below, its 2 % target is not compatible with its price stability objective. Leaving the federal funds rate unchanged within a target range at 1.5 to 1.75 % the monetary policy remains accommodative and well below its longer run neutral level at 2.9 %. In this environment, it is quite likely that the FOMC will increase the federal funds rate at its next meeting (June 13).
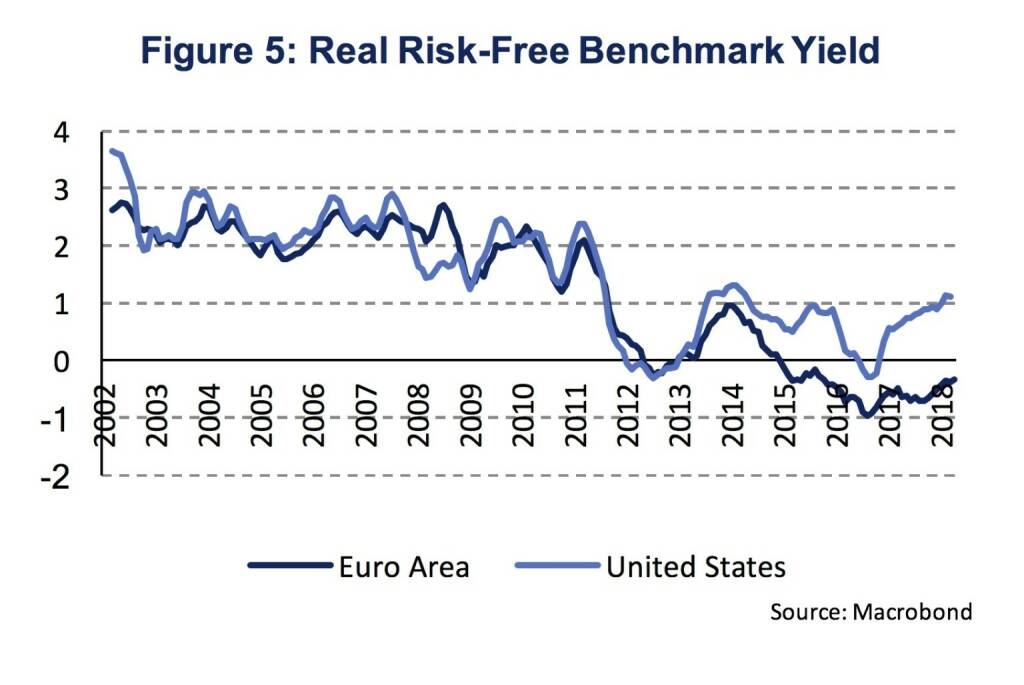
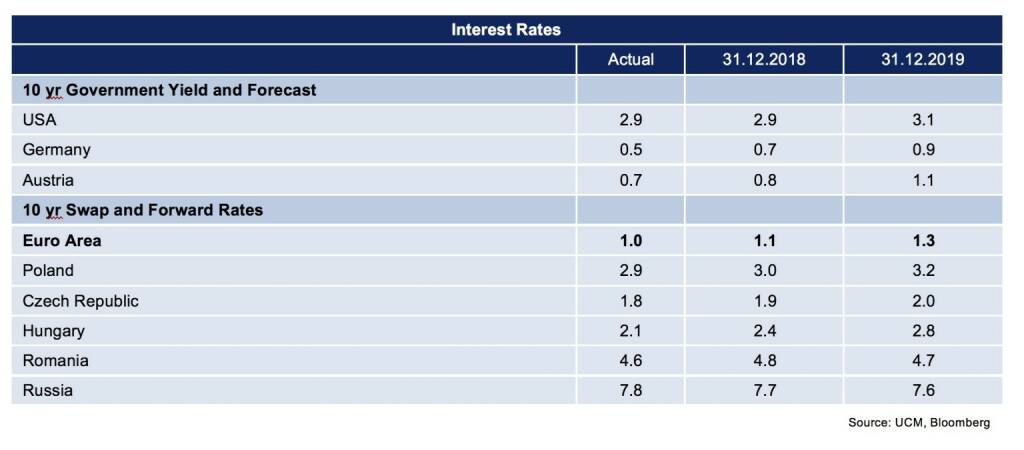
Overall, monetary policy remains accommodative both in the Euro Area and the United States. The degree of monetary stimulus, however, differs quite substantially. Risk-free real interest rates remain negative in the Euro Area while being close to 1 % in the United States. Figure 5 shows the development of the divergence of real risk-free rates following the Euro Area crisis in 2013. Given that the real natural rate of interest, which is consistent with stable inflation absent shocks to demand and supply, is only 40 basis points lower in the Euro Area compared to the United States, monetary conditions are indeed more accommodative in the Euro Area.
Authors
Martin Ertl Franz Zobl
Chief Economist Economist
UNIQA Capital Markets GmbH UNIQA Capital Markets GmbH
_of_us_post_wwii_expansions_and_recessions)
Latest Blogs
» BSN Spitout Wiener Börse: Wienerberger zur...
» SportWoche Party 2024 in the Making, 14. A...
» SportWoche Party 2024 in the Making, 15. A...
» Österreich-Depots unveändert (Depot Kommen...
» Börsegeschichte 18.4.: Mayr-Melnhof (Börse...
» SportWoche Party 2024 in the Making, 18. A...
» Reingehört bei A1 Telekom Austria (boersen...
» News von Verbund und VIG, Research zu Palf...
» Nachlese: Matejka Poetry Slam, B&C, 10% au...
» Wiener Börse Party #631: XXS-Folge mit ein...

Weitere Blogs von Martin Ertl
» Stabilization at a moderate pace (Martin E...
Business and sentiment indicators have stabilized at low levels, a turning point has not yet b...
» USA: The ‘Mid-cycle’ adjustment in key int...
US: The ‘Mid-cycle’ interest rate adjustment is done. The Fed concludes its adj...
» Quarterly Macroeconomic Outlook: Lower gro...
Global economic prospects further weakened as trade disputes remain unsolved. Deceleration has...
» Macroeconomic effects of unconventional mo...
New monetary stimulus package lowers the deposit facility rate to -0.5 % and restarts QE at a ...
» New ECB QE and its effects on interest rat...
The ECB is expected to introduce new unconventional monetary policy measures. First, we cal...