USA: The impatience of stock markets (Martin Ertl)
- We examine the link between wage growth and inflation.
- Prices are rigid and adjust slowly. A one %-age point rise in wages leads to 0.6 %-age points increase in prices of goods and services. It takes around one year for prices to fully adjust.
Stock and bond markets plummeted following the release of the January US employment report on Friday 2nd February. Some commentators argued that this is not pure coincidence but investors’ fear of higher wages, higher inflation and higher treasury bond yields. The most important figures of the monthly report from the Bureau of Labor Statistics (BLS) are the non-farm payrolls job growth (NFP), the unemployment rate (UR) and the average hourly earnings (AHE). The prints in NFP (200.000 new jobs), the unemployment rate (4.1 %) were unexciting, while the AHE jumped to 2.9 % annual earnings growth and the release from the previous month was revised upward from 2.5 % to 2.7 %. AHE are usually a volatile time series and it should be compared to other series measuring the earnings development (the Atlanta Fed median wage tracker and the quarterly Employment Cost Index are two prominent examples) and smoothed (6 months) for detecting trends in growth rates (Figure 1). While the level of the growth rate moved since around 2015, neither of three well-known wages measures shows a significant, sustained upward trend or acceleration.
How are wage trends distributed across skill occupations, educational degrees, sectors and age-cohorts; in other words: Who earns more? In Q4 2017, the median wage rose by 3.2 % annually, the 75th percentile of the wage distribution increased by 4.9 % while wages at the 25th percentile fell by 2.2 % annually. Workers in occupations requiring higher skills earned 3.6 % more, while middle and low skilled occupations saw their wage rise by 3.2 % and 2.8 % in the final quarter of last year. Workers with a bachelor’s degree or higher encountered highest earnings rises (3.6 %) compared to persons with college degree (3.0 %) or high school degree or less (3.1 %). Across sectors, wage growth was higher in public administration (3.8 %), trade (3.6 %) and finance & business (3.5 %). Manufacturing wages rose by 3.4 % and wage growth was lowest in leisure & hospitality (2.8 %). Finally wage growth is highest among younger cohorts aged 16 to 24 years (7.1 %) and lowest for the elderly aged above 55 years (2.0 %). This seems to mirror a cliché: The young, highly skilled working in finance & business (or public services) ripped off the largest earnings increases last year.
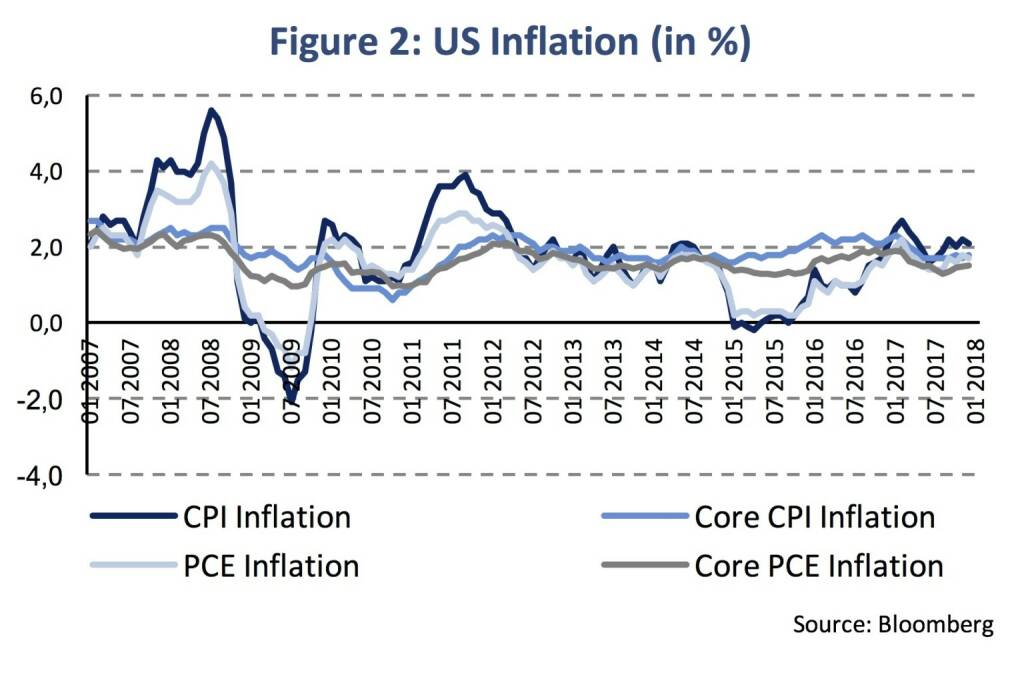
Rising wage growth is usually seen as a sign of increasing labor market tightness. A tighter labor market implies less slack in the economy. The relationship between economic slack and inflation is formally known as the Phillips Curve. Conditions that push the economy to full employment lead to increased cost pressures on firms and capacity constraints. Cost pressures lead to higher wages and labor costs. Capacity constraints and strained supply chains in the face of high demand push up intermediate costs. In response to these costs, firms tend to increase the prices they charge for their goods and services, leading to price inflation. Core CPI inflation (excluding volatile components such as food and energy) was 1.7 % (y/y) and the personal consumption expenditure (PCE) core price index was 1.5 % (y/y) in December (Figure 2).
Inflation expectations also affect the transmission of cost pressures to price inflation. If individual firms expect economy-wide prices to increase at a fast pace, they will be reluctant to slow their own price increases. If many firms follow the same reasoning and expect other firms to keep raising prices, then overall inflation will remain strong.
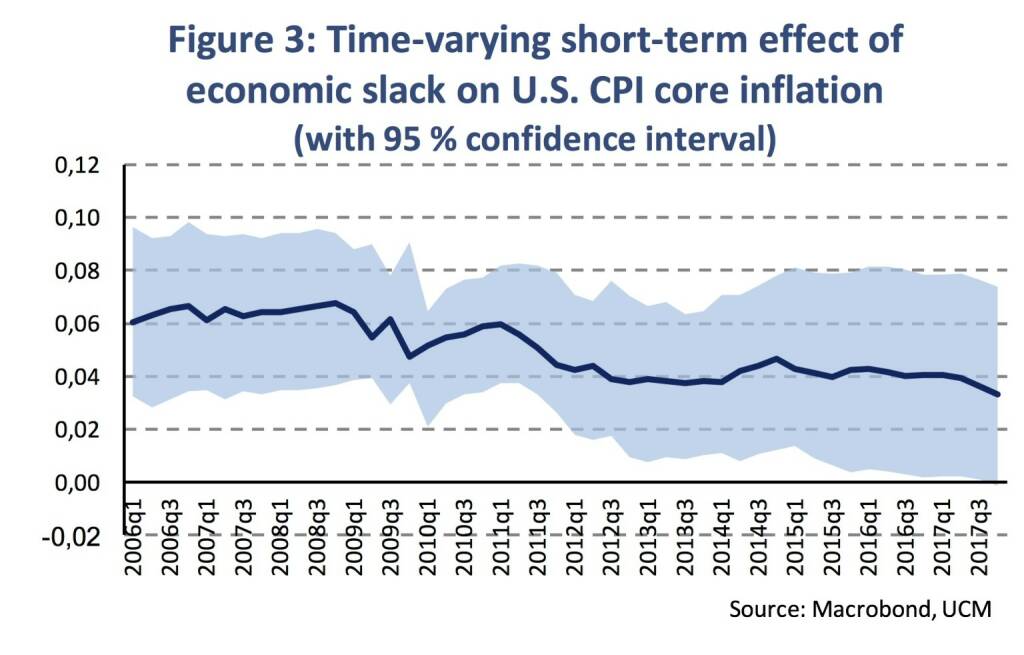
There is currently much uncertainty regarding the functioning of the Phillips Curve. In her last press conference as the chair of the Federal Reserve, J. Yellen recognizes “that there is uncertainty about what’s holding inflation down”. However, emphasizing the Open Market Committee’s belief of its transitory nature. Many have postulated that the Phillips Curve has ceased to exist, others have argued that the relationship has weakened over time and some argue that the relationship is well and alive.[1] We estimate a supply factor augmented New Keynesian Phillips Curve, which includes the output gap as a measure of economic slack, long term inflation expectations, lagged core CPI inflation, and the change in import prices. The results show an economically significant long-term effect of the output gap on US core inflation [2]. During the period 1990 to 2017, a rise in the output gap of 1 % is associated with a long-term increase of core inflation of 0.35 %-points. However, the short term, or same period, effect is relatively weak with 0.04 %-points only. Looking at the dynamics of this relationship by applying rolling two-stage least square regressions, shows that the effect of the output gap on U.S. core inflation has weakened but stayed constant for quite some time now (Figure 3). The short-term effect has declined from 0.06 %-points to 0.04 %-points, while the long-term effect has declined from 0.4 %-points to 0.2 %-points [3]. Hence, we share the view that the Phillips Curve is active, though, the transmission of economic slack on U.S. prices has weakened over time.
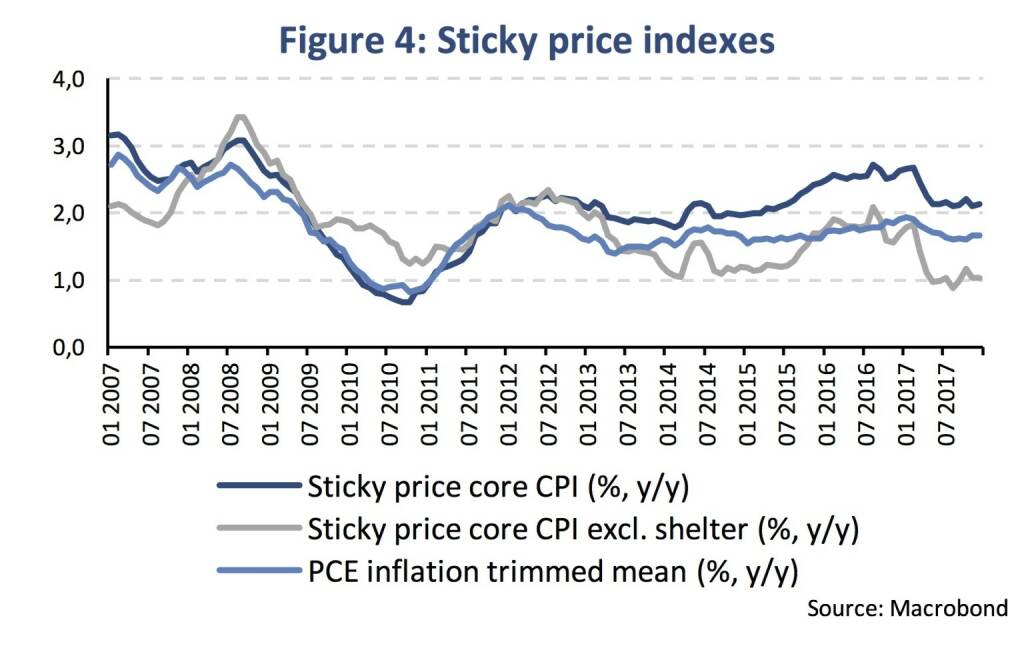
One argument for the weaker relationship is increased central bank credibility reflecting inflation expectations to have become more anchored. Sticky prices appear to incorporate expectations about future inflation to a greater degree than prices that change on a frequent basis. The ‘trimmed’ mean inflation index is constructed by excluding the items that registered the biggest increases or decreases in a given month, hence, it is an alternative measure of the underlying trend (Figure 4). These time series suggest that underlying price trends have not yet adapted to higher inflation expectations, except for shelter prices which have decoupled since 2013.
Vector autoregressive (VAR) models allow us to study relationships and dynamic effects of macroeconomic variables. We test the links between wages, inflation expectations and inflation rates in such a VAR model. From the above monthly time series, we include the Atlanta Fed median wage tracker (3-month average), the sticky price index and the core CPI index (all in y/y-changes) in the model with data since January 2000 (model 1). Alternatively, the trimmed mean PCE time series is included instead of the sticky price core CPI index (model 2) [4]. Both time series usually gauge underlying price trends very well and are said to bear a forward-looking component. The impulse-response functions (IRFs in figure 5) examine 1 %-age points positive shock in wages and respective dynamic responses over a period of more than three years (40 months).
The dynamic effect of a wage increase is statistically significant, positive and unambiguous and cumulates to a rise in sticky prices of 0.6 %-age points after around one year. Hence, it takes some time for firms to adjust prices upwardly due to higher wages. Wages also effect the core CPI price index positively, although to a lesser extent (and not statistically significant), what seems plausible. Side note: 10-year treasury yields have no significant relationships to wages and prices in the model.
In this short paper, we take a closer look at several prominent indicators for the US wage development. While the level of wage growth has moved up since 2015, there is no consistent evidence for a short-term acceleration in the data. In addition, the short-term effect of labor market tightness on the overall inflation rate is alive but small and there is evidence that it has weakened over time. Finally, in case of higher wage growth, we sketch that it takes some time for inflation to adjust to higher wages.
Authors
Martin Ertl Franz Zobl
Chief Economist Economist
UNIQA Capital Markets GmbH UNIQA Capital Markets GmbH
[1]Gordon, R., (2013), The Phillips Curve is alive and well. Inflation and the NAIRU during the slow recovery, NBER Working Paper 19390, National Bureau of Economic Research.
[2]We model core CPI inflation (y/y) based on the following variables and sources: lagged core CPI inflation (U.S. Bureau of Labor Statistics), 10y CPI inflation expectations (Federal Reserve Bank of Philadelphia Survey of Professional Forecasters), output gap (Congressional Budget Office, U.S. Bureau of Economic Analysis), import prices (U.S. Bureau of Labor Statistics). Endogeneity is partially accounted for by instrumenting inflation expectations and the output gap with two lags of their own variables. Rolling regressions are based on a constant 60 quarters sample.
[3]The long-term effect is calculated as the output gap coefficient divided by 1 minus the coefficient on lagged U.S. core inflation.
[4]The VAR is specified with one and four lags according to the AIC and other order-selection criteria. The eigenvalues lie within the unit-circle.

_of_a_1_prozent-age_points_positive_shock_in_wages)

Latest Blogs
» Börse-Inputs auf Spotify zu u.a. Beiersdor...
» BSN Spitout Wiener Börse: Erste Group über...
» Österreich-Depots: Weekend-Bilanz (Depot K...
» Börsegeschichte 19.4.: Rosenbauer (Börse G...
» Aktienkäufe bei Porr und UBM, News von VIG...
» Nachlese: Warum CA Immo, Immofinanz und RB...
» Wiener Börse Party #633: Heute April Verfa...
» Wiener Börse zu Mittag schwächer: Frequent...
» Börsenradio Live-Blick 19/4: DAX eröffnet ...
» SportWoche Party 2024 in the Making, 19. A...

Weitere Blogs von Martin Ertl
» Stabilization at a moderate pace (Martin E...
Business and sentiment indicators have stabilized at low levels, a turning point has not yet b...
» USA: The ‘Mid-cycle’ adjustment in key int...
US: The ‘Mid-cycle’ interest rate adjustment is done. The Fed concludes its adj...
» Quarterly Macroeconomic Outlook: Lower gro...
Global economic prospects further weakened as trade disputes remain unsolved. Deceleration has...
» Macroeconomic effects of unconventional mo...
New monetary stimulus package lowers the deposit facility rate to -0.5 % and restarts QE at a ...
» New ECB QE and its effects on interest rat...
The ECB is expected to introduce new unconventional monetary policy measures. First, we cal...